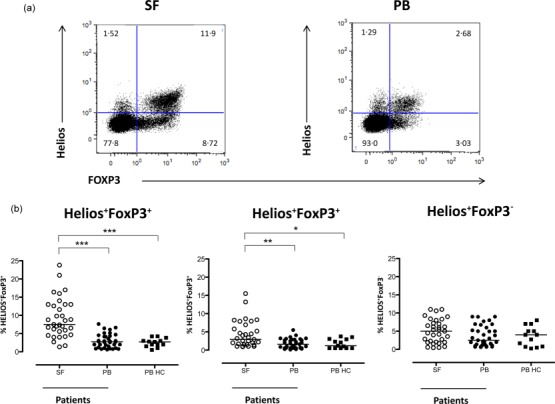
Figure 1.

The Helios+FoxP3+ and Helios−FoxP3+ T cell populations are enriched in synovial fluid (SF) compared to blood from patients with inflammatory arthritis. Flow cytometric analysis of Helios and FoxP3 expression was performed in SF and peripheral blood (PB) of patients with inflammatory arthritis, and blood from healthy controls (HC). Analysis of the distribution of Helios and FoxP3 expression was performed on CD14−CD3+CD4+ T lymphocytes (defined by forward- and side-scatter). Representative dot-plots of Helios and FoxP3 stainings are shown for SF and PB (a). The graphs summarize the respective frequencies of Helios+FoxP3+, Helios–FoxP3+ and Helios+FoxP3− (b) in CD3+CD4+ T cell subpopulations in SF (n = 33) and PB (n = 35) from patients and PB from HC (n = 11) (for diagnosis status of the study objects included please see the Materials and methods section). Data were analysed using the Kruskal–Wallis test with Dunn’s multiple-comparison post test, ***P < 0·001, **P < 0·005 and *P < 0·05.
