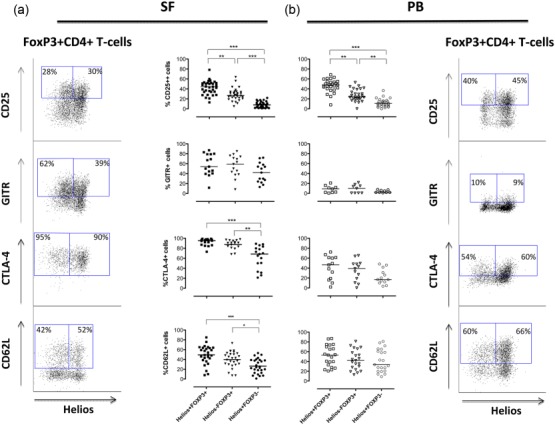
Figure 3.

The interleukin (IL)-2 alpha-receptor CD25 is expressed more frequently on Helios+FoxP3+ compared to Helios−FoxP3+CD4+ T cells. A comparison of the different subpopulations expression pattern, in patient-derived synovial fluid (SF) (a) and peripheral blood (PB) (b), is shown for the following cell-surface markers. CD25 (SF n = 33, PB n = 27), glucocorticoid-induced tumour necrosis factor (TNF) receptor family-related gene (GITR) (SF n = 15, PB n = 9), cytotoxic T lymphocyte antigen (CTLA)-4 (SF n = 17, PB n = 13) and CD62L (SF n = 27, PB n = 21). Analysis of the distribution of the different Treg markers was performed on CD14−CD3+CD4+ T lymphocytes (defined by forward- and side-scatter) (for diagnosis status of the study objects included please see the Materials and methods section). The dot-plots display staining pattern and gating strategies for these markers in FoxP3+CD4+CD3+ cells in SF (left column) and PB (right column). Data was analysed using the Kruskal–Wallis test with Dunn’s multiple-comparison post-test, significance: ***P < 0·001, **P < 0·005 and *P < 0·05.
