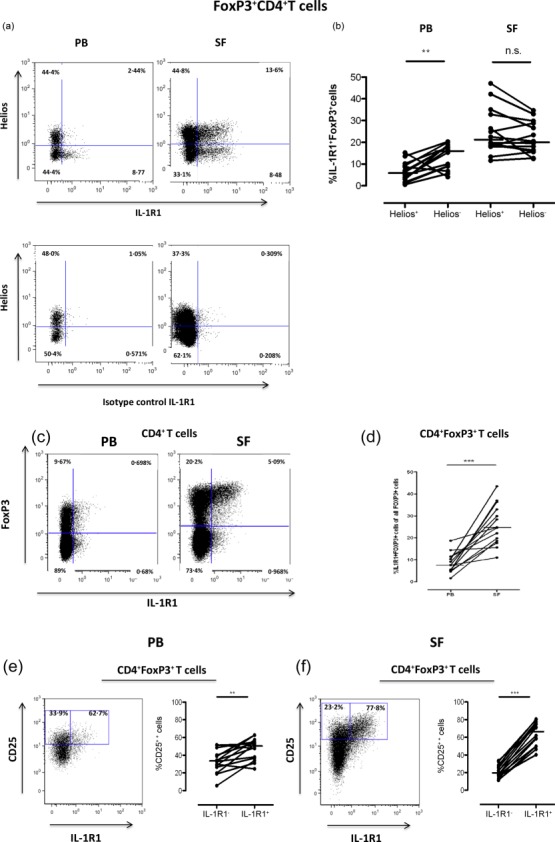
Figure 6.

Expression of interleukin (IL)-1R1 in synovial cells is restricted to FoxP3+CD25++CD4 T cells. (a) Representative stainings of the distribution of IL-1R1 expression on Helios+ and Helios− FoxP3+ T cells (upper panel) and isotype control of the IL-1R1 antibody (lower panel) in peripheral blood (PB) and synovial fluid (SF). (b) The graph summarizes the frequencies of IL-1R1-positive Helios− and Helios+FoxP3+ cells in PB and SF. (c) The dot-plots show the distribution of IL-1R1 expression on CD4+ T cells in PB and SF, respectively, and the graph (d) summarizes the frequencies of IL-1R1+FoxP3+ T cells in PB and SF (c). Representative dot-plots and summary graphs of the distribution of CD25 and IL-1R1 expression in the FoxP3 population are shown in (e) (PB) and (f) (SF). All stainings were performed on paired PB and SF samples from 14 patients diagnosed with inflammatory arthritis [nine ankylosing spondylitis (SpA) and five rheumatoid arthritis (RA)]. Data were compared using the Wilcoxon’s signed-rank test, **P < 0·001 and ***P < 0·0001.
