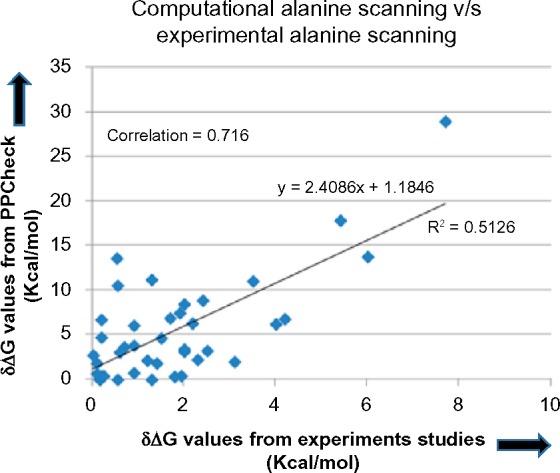
Figure 3.

Scatter plot showing the correlation between changes in binding energy of the protein complex (measured in kcal/mol) as measured from PPCheck and experimental studies. A correlation of 0.716 was observed for 40 mutations, selected randomly from ASEdb. Please note that the regression value is about 0.513 and the proportionality constant between the two terms is not 1.
