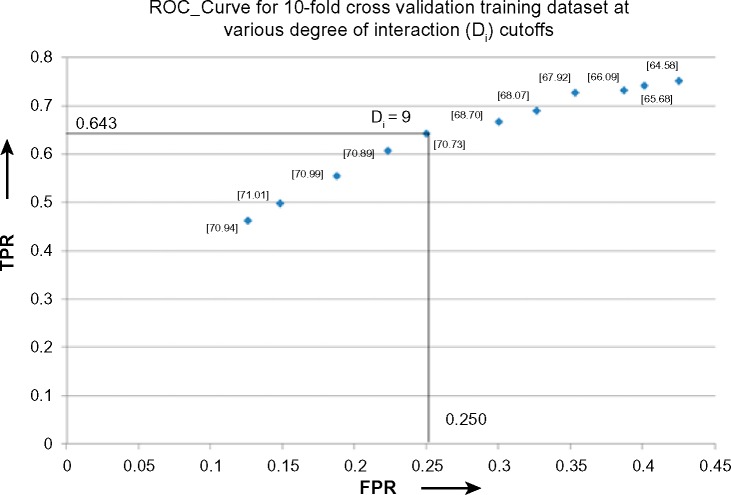
Figure 4.
TPR versus true negative rate curve for the ESRI, represented as Di, for 10-fold mixed training dataset. Residues with various ESRI (from 5 to 15) were treated as hotspots in a 10-fold mixed dataset (192 mutations from ASEdb and 126 mutations from BID) in order to select an optimum ESRI that can be used in a generalized manner to predict hotspots. Accuracy, obtained at the respective cutoffs, is represented in the square [-] brackets.

