. 2015 May;48(5):249–255. doi: 10.5483/BMBRep.2015.48.5.037

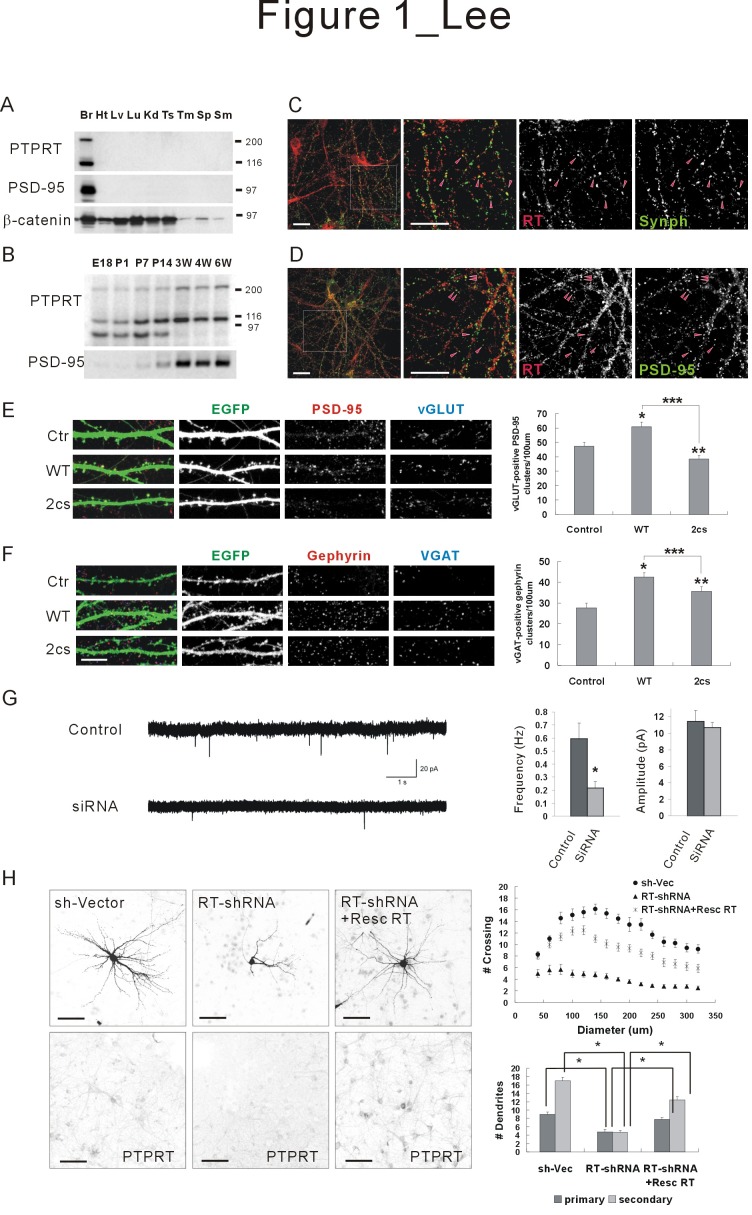
Fig. 1. PTPRT regulates synaptic formation and dendritic arborization in hippocampal neurons. (A) Tissue distribution patterns of PTPRT revealed by Western blot analysis. Monoclonal antibodies specific for PTPRT were used. Br, brain; Ht, heart; Lv, liver; Lu, lung; Kd, kidney; Ts, testis; Tm, thymus; Sp, spleen; Sm, skeletal muscle. PSD-95 and β-catenin were used as controls. (B) Developmental pattern of PTPRT in the rat brain. E, embryonic; P, postnatal days. PSD-95 was used as a control. (C, D) PTPRT co-localized to neuronal synapses stained with synaptophysin and PSD-95. Scale bar, 20 μm. (E) The number of excitatory synapses (vGLUT-positive PSD-95 clusters). Mean ± SEM. n = 30 dendrites for control, 31 for WT-RT (wild-type), and 30 for 2cs-RT (inactive). Scale bar, 10 μm. (F) The number of inhibitory synapses (vGAT-positive gephyrin clusters). Mean ± SEM. n = 27 dendrites for control, 28 for WT-RT, and 28 for 2cs-RT. Scale bar, 10 μm. (G) PTPRT knock-down of PTPRT in cultured neurons decreased the frequency, but not amplitude, of mEPSCs (n = 12 for control and n = 10 for shRNA). (H) Attenuated dendritic arborization upon knockdown of PTPRT. When rat hippocampal neurons were transfected with PTPRT-shRNA, the numbers of dendrites and arborization were decreased significantly and rescued by the addition of Resc PTPRT in this context. Mean ± SEM of data from 9 control neurons, 10 PTPRTshRNA neurons, and 9 PTPRT-shRNA + Resc PTPRT neurons are shown. Scale bar, 100 μm.

Fig. 1.