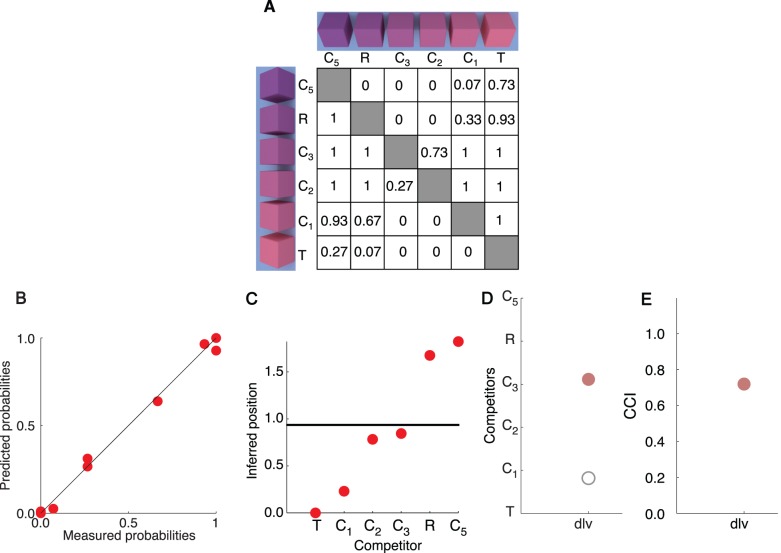
Figure 3.
From subject's choices to color constancy indices. (A) The choice matrix for one subject (dlv) and target block (rose) in the illuminant-changed condition. For each pair of competitor blocks, the matrix indicates the proportion of trials in which the competitor from each row was chosen when paired with the competitor from each column. (B) The relationship between measured probabilities (shown in A) and those predicted based on the recovered positions of the target and the competitors. The log likelihood value corresponding to the solution shown was −15.7. For the illuminant change condition, the solution log likelihoods (across targets and subjects) ranged from −33.1 to −11.25 with a mean of −21.25. (C) Recovered positions of the target (horizontal black line) and competitors (red circles) corresponding to the solution in B. (D) The inferred match in the illuminant-changed condition is plotted as a filled circle (rose) relative to the space of competitors. The corresponding inferred match in the illuminant-constant condition is plotted as an open circle (gray). (E) The color constancy index corresponding to subjects' choices, computed from the inferred matches shown in D.

