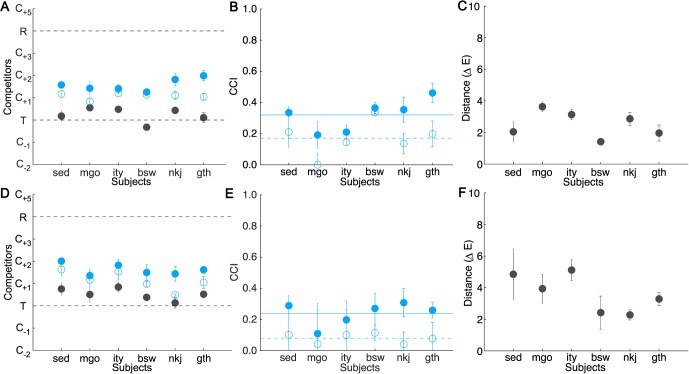
Figure 9.
Results of Experiment 3. The simple scene condition is shown in the top and the complex scene in the bottom row. The illuminant-constant condition is plotted in gray; the illuminant-change conditions are plotted in blue (filled circles: local contrast preserved; open circles: local contrast silenced). The figure follows the same conventions as Figure 4. (A and D) Position of the inferred match across conditions. (B and E) CCIs averaged across targets. Horizontal lines indicate average CCI across subjects (solid line: local contrast preserved; dashed line: local contrast silenced). Error bars are symmetric and are truncated if the lower limb extends past the axis limit (0.0). (C and F) Distance between the inferred match (illuminant-constant condition) and the target block in ΔELab units averaged across targets.

