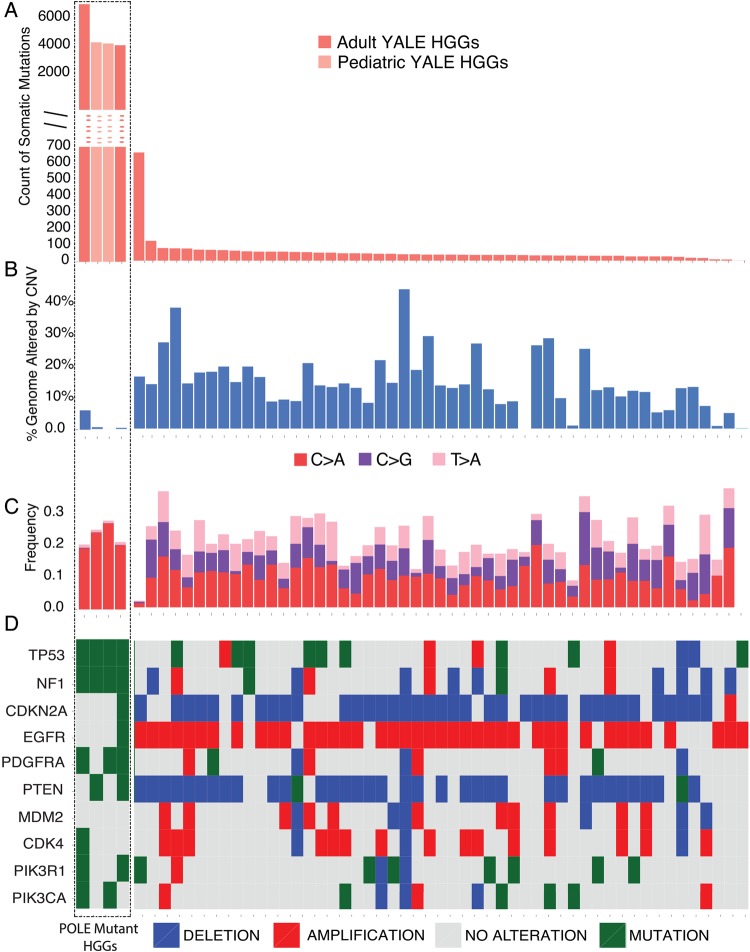
Fig. 1.
Mutation spectrum for 55 primary HGGs. Each of the 55 tumor samples is plotted along the horizontal axis. The vertical axis shows (A) the number of protein altering somatic mutations or (B) percent genome altered. The 4 HGG cases (marked by the dotted-border line, from left to right, GBM-60001, GBM-60003, GBM-60004, and GBM-10468) are ultramutated. These samples show a significantly increased number of somatic mutations but are genomically stable based on the frequency of large-scale copy number alterations (shown as percent genome altered) (B). The sample with increased number of somatic mutations in the non-POLE mutant group had a somatic MSH6 mutation, characterized by increased C > T transitions (Supplementary Fig. S1). (C) Analysis of mutation signatures as determined by the relative percentages of all 6 possible types of single nucleotide mutation types. Only the signatures with significant changes between the ultramutated and non-ultramutated cases are presented. The ultramutated samples, which cluster to the left side of the panel and are marked by the box, are characterized by an increased percentage of C > A transversions and decreased C > G and T > G mutations relative to the other samples. See Supplementary Fig. S1 for the relative distribution of all mutational signature subtypes. (D) Oncoprint representing the CNV and single nucleotide polymorphism (SNP)/insertion-deletion (Indel) status for the frequently altered genes in GBM. SNPs and Indels are depicted as “Mutations.” For the ultramutated cases, there are no CNV events affecting genes that are frequently amplified or deleted in GBM, such as EGFR, PTEN, PDGFRA, CDKN2A, CDK4, and MDM2 (Supplementary Table S4).

