
Figure 2.
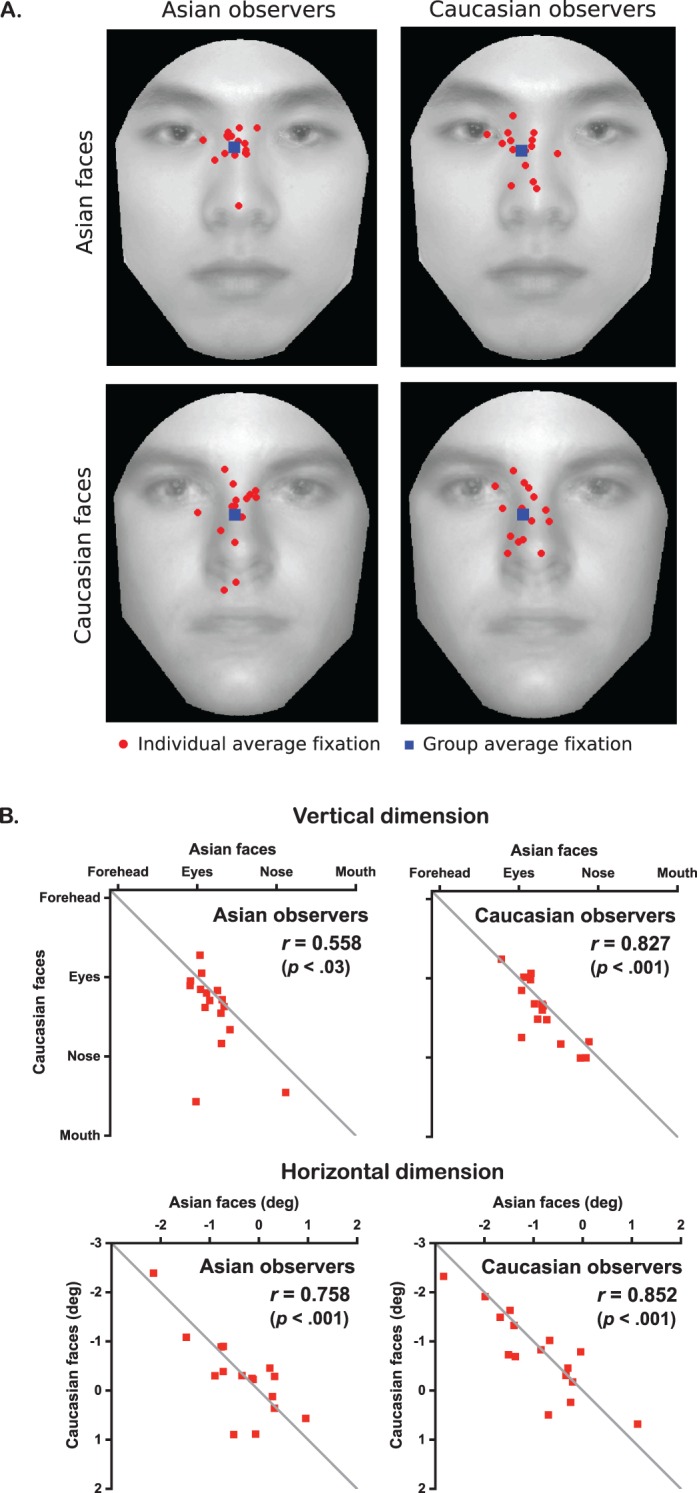
Experiment 1 results (short free-eye-movement tasks). (A) The first fixations averaged across 500 trials for each individual (red dots). The blue squares denote average first fixations across observers. The faces illustrated here are the images averaged from the (Asian or Caucasian) faces actually presented in the experiment. (B) Correlations r of the first fixation positions across Asian and Caucasian face stimuli. The horizontal positions denote the distances from the vertical midline of the face (negative: left of midline).