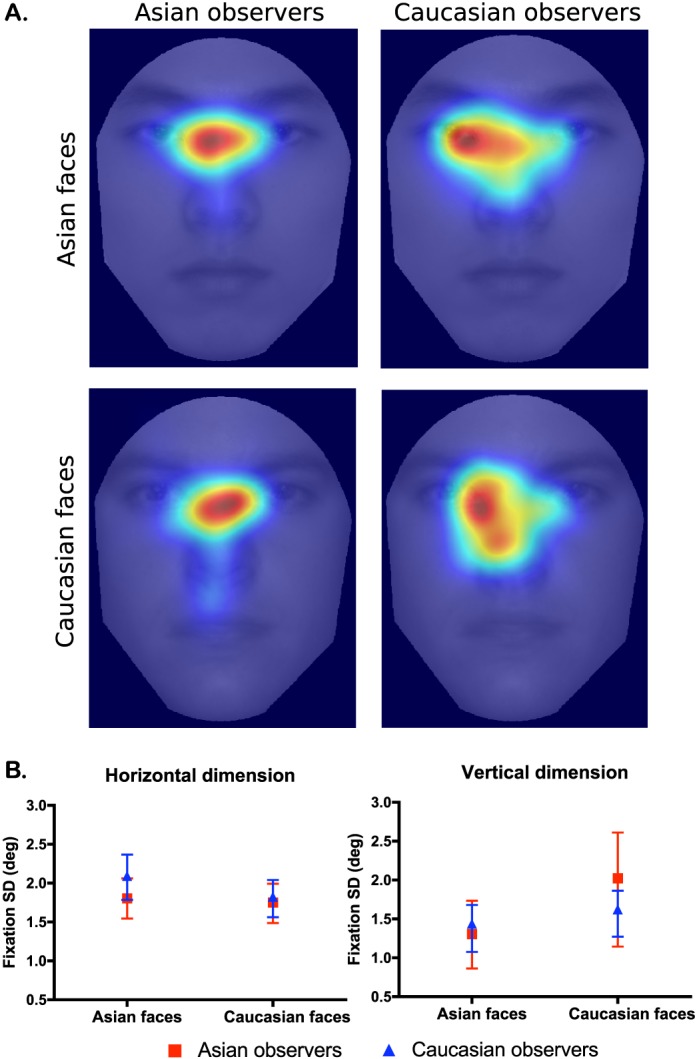
Figure 3.

Distributions of the first fixation positions from Experiment 1. (A) Each heat map considers all 500 trials from the 16 observers, totaling 8,000 fixation positions. The number of fixations was counted for each pixel, and the resulting frequency map was filtered with a radially symmetric Gaussian kernel with a standard deviation of 0.52° in order to generate the heat map. Warmer color indicates a higher fixation frequency on the pixel, and cooler color indicates a lower fixation frequency. In visually inspecting heat maps, statistically significant but small differences on fixation patterns might not always be visible, and visual differences on heat maps cannot be interpreted as significant differences. Statistical comparisons should be based on ANOVA and bootstrapping. (B) The standard deviations of the fixation distributions did not vary significantly across cultures. The error bars denote the 95% confidence interval of the standard deviation estimated by bootstrapping.
