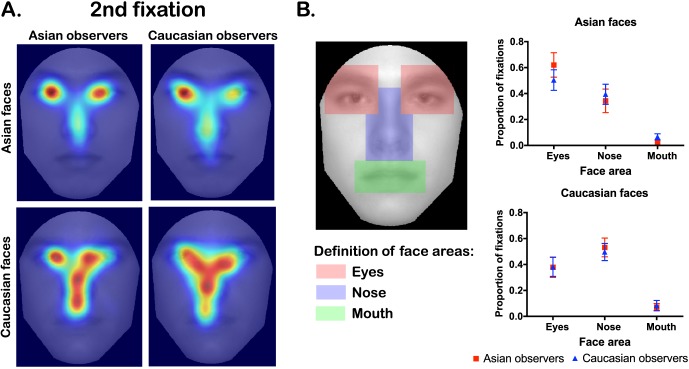
Figure 5.
(A) Distributions of the second fixation positions from Experiment 2. Each heat map considers all 500 trials from the 16 observers in that group, generated using similar methods as in Figure 3A. Warmer color indicates a higher fixation frequency on the pixel, and cooler color indicates a lower fixation frequency. (B) Proportions of the second fixations on distinct face areas covering the eyes, nose, and mouth, averaged by observer culture and face race. The face illustrated here is the image averaged across the 20 Asian and Caucasian faces actually presented in the experiment. The error bar denotes ±1 standard error of the mean.

