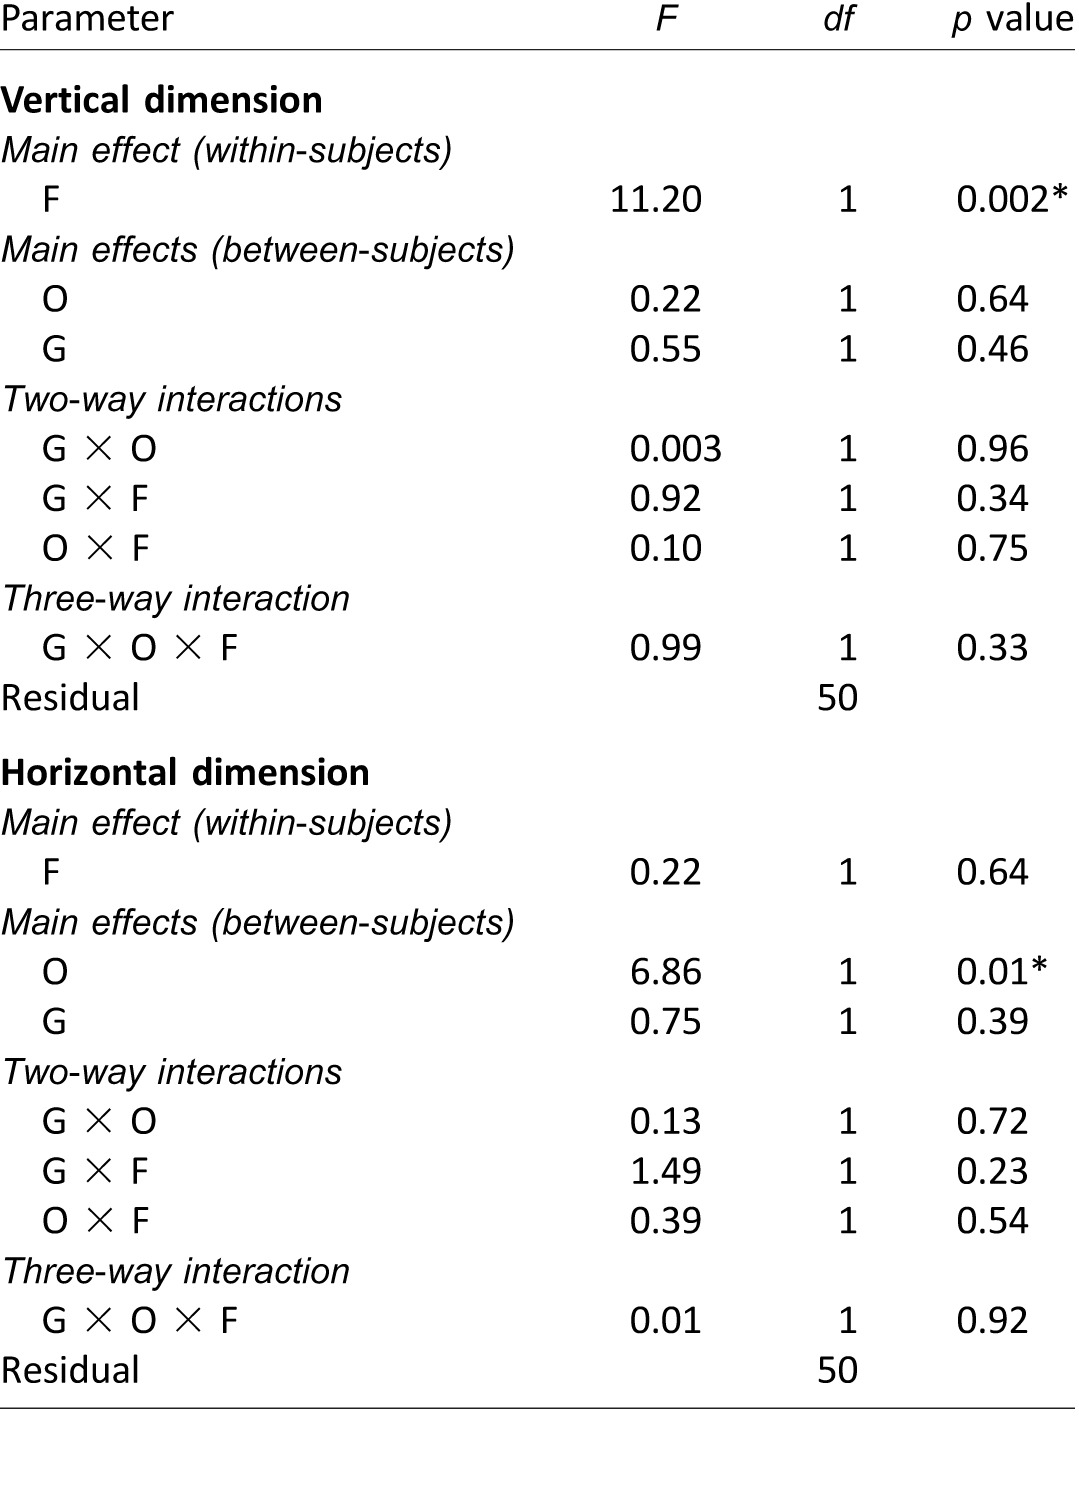
Table 8.
Mixed-model repeated measures ANOVA results on potential differences of the first fixation positions between Experiments 1 and 4, analyzed separately for the vertical and horizontal dimensions. The analysis compared two participant groups (G): 32 observers from Experiment 1 and 22 observers from Experiment 4. Notes: F: face race; O: observer culture. Significant p values (i.e., p < 0.05) are marked with asterisks (*).

