. 2015 Jun 30;48(6):342–347. doi: 10.5483/BMBRep.2015.48.6.157

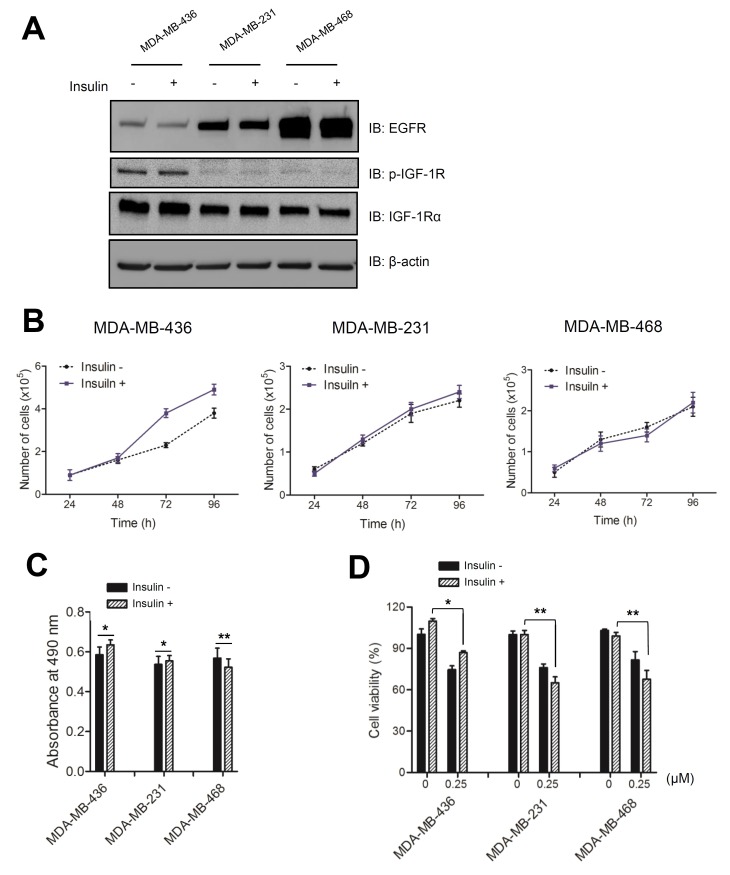
Fig. 1. Insulin stimulates cell growth in an IGF-1R-activated TNBC cell line. (A) Cells were cultured in the presence (+) or absence (−) of 5 μg/ml insulin. Immunoblot analysis of lysates was performed using anti-EGFR, anti-IGF-1R, and anti-p-IGF-1R antibodies. (B) Growth curves for each TNBC cell line treated with 5 μg/ml insulin were constructed using GraphPad software. The error bars were calculated based on three independent experiments. Values plotted are the means ± standard deviation (SD; n = 3). (C) Cells were cultured in the presence of 5 μg/ml insulin for 3 d and then treated with MTS solution for 1 h. The absorbance was measured at 490 nm. (D) TNBC cell lines were cultured in the presence of 5 μg/ml insulin for 3 d, treated with staurosporine (0 or 0.25 ㎛) for 6 h and then an MTS assay was performed. Statistical values for the MTS assay are expressed as the means ± SD (n = 3; Student’s t-test, *P < 0.05, **P < 0.001).

Fig. 1.