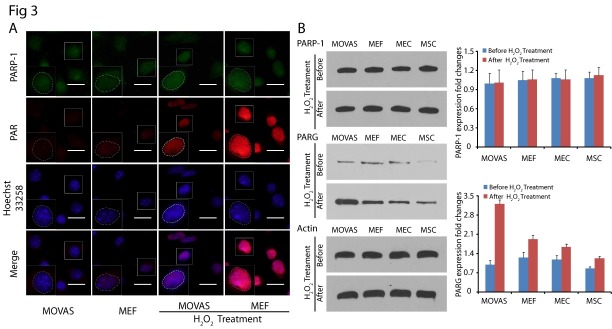
Fig. 3. High expression of PARG level promotes PAR degradation in MOVAS. (A) Representative immunostaining images of PARP-1 (green) and PAR (red) in H2O2 treated MOVAS and MEFs cells at 20 min. Nuclei were stained with Hoechst 33258 (blue), and outlined by white dashed lines in enlarged boxes to denote the localization of PARP-1 and PAR in nuclei. (B) The expression of PARP-1 and PARG in cells were examined at 1 h following H2O2 treatment, β-actin was used as the protein loading control. The error bars represent the standard deviation.

