Fig. 6.

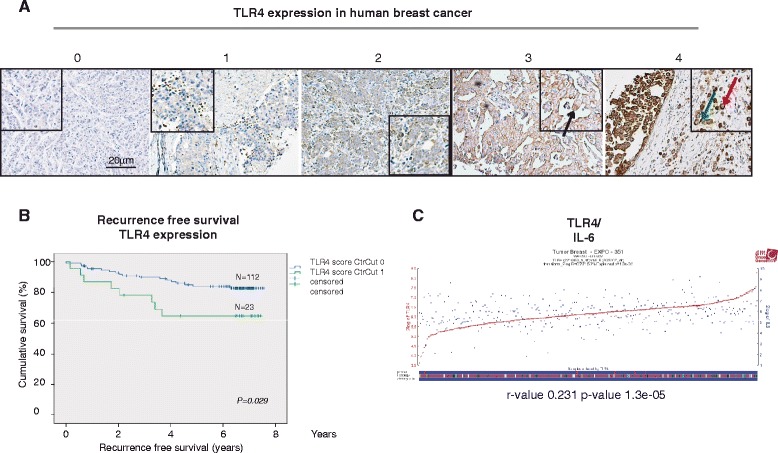
Toll-like receptor 4 (TLR4) expression in breast tumors and survival curves. a Immunohistochemical TLR4 expression sample images from breast cancer tissue microarray cores, from left to right: negative (0), weak (1), moderate (2), strong (3) and very strong (4). Boxes with magnification and arrows to indicate localization (black arrow membranous, green arrow leukocyte, red arrow cytoplasmic staining. b Kaplan-Meier curves illustrating differences in recurrence-free survival according to TLR4 cytoplasmic expression in breast tumors. Cytosolic scoring parameters were grouped into 0–2 (0) and 3–4 (1) critical cutoffs. c Gene expression profile analysis of TLR4 mRNA in relation to IL-6 in (R2: microarray analysis and visualization platform [40]; Tumor breast EXPO-351)
