
Fig. 5.
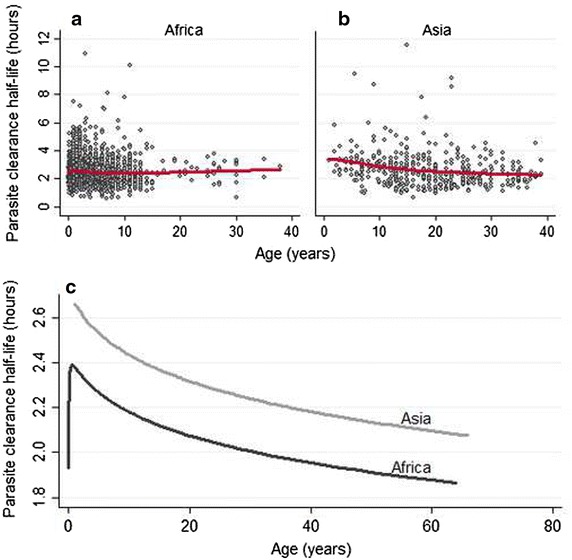
Relationship between patient age and PC1/2 in patients in areas with artemisinin-sensitive parasites. (1) Observed data in Africa (a) and Asia (b) with red line showing locally weighted scatter-plot smoothing estimator (LOWESS); only patients with 6-h sampling and enough data points for the full Parasite Clearance Estimator model to be fitted are presented; (2) predicted relationship from multivariate model using fractional polynomials (c); adjusted for treatment group, region, initial parasitaemia, presence of lag phase and study design characteristics