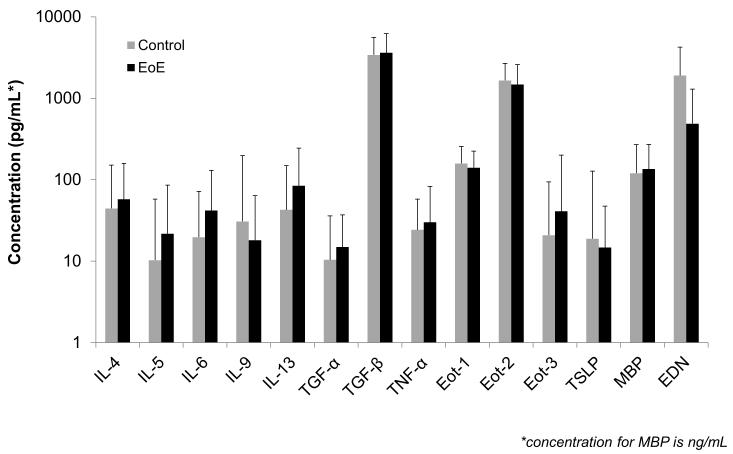
Figure 1.
Comparison of serum biomarkers for cases of EoE (black bars) and non-EoE controls (gray bars). The top of the bars represent the mean biomarker values, and the error bars represent the standard deviation. The y axis is on a log scale, and all concentrations are in pg/mL with the exception of major basic protein (MBP) which is in ng/mL.

