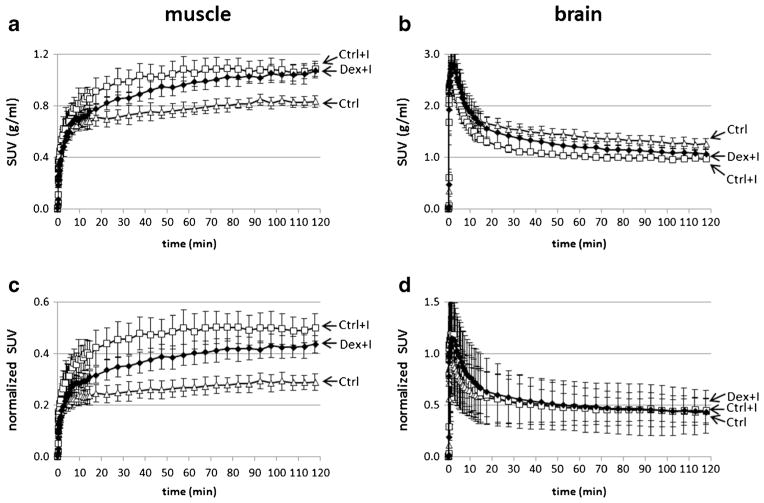
Fig. 4.
Time-activity curves for the Ctrl (triangle), Ctrl+I (square), and Dex+I (solid diamond) groups in the skeletal muscle and the brain. Markers indicate means, and error bars indicate standard deviations. The tissue activity concentrations were divided by the injected activity dose per unit of body weight in order to obtain the standard uptake values (SUV). a muscle SUV vs. time curves. b brain SUV curves. To test if the differences in tissue 6-[18F]FDG concentration could be due to differences in plasma concentration of 6-[18F]FDG, the curves are further divided by the average of arterial plasma activities to generate c plasma-normalized muscle SUV (unitless) and d plasma-normalized brain SUV (unitless).

