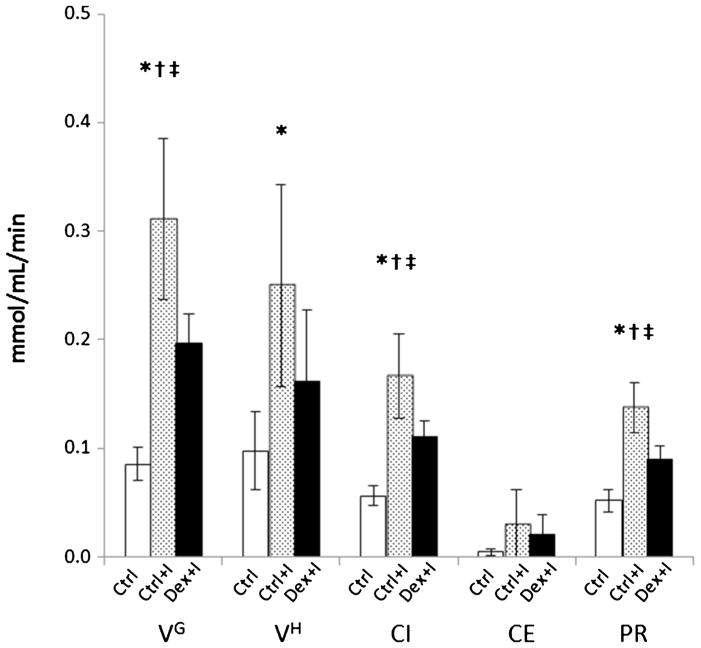
Fig. 6.
Estimated values of the physiologic parameters of Vmax of glucose transporters and hexokinase (VG, VH, respectively). Glucose cellular influx, cellular efflux, and phosphorylation rates (CI, CE, and PR, respectively). The □,
 , and ■ bars are the results of the Ctrl, Ctrl+I, and Dex+I groups, respectively. *p<0.05 for Ctrl vs. Ctrl+I, Ctrl vs. Dex+I as †, and Ctrl+I vs. Dex+I as ‡.

