Fig. 1.
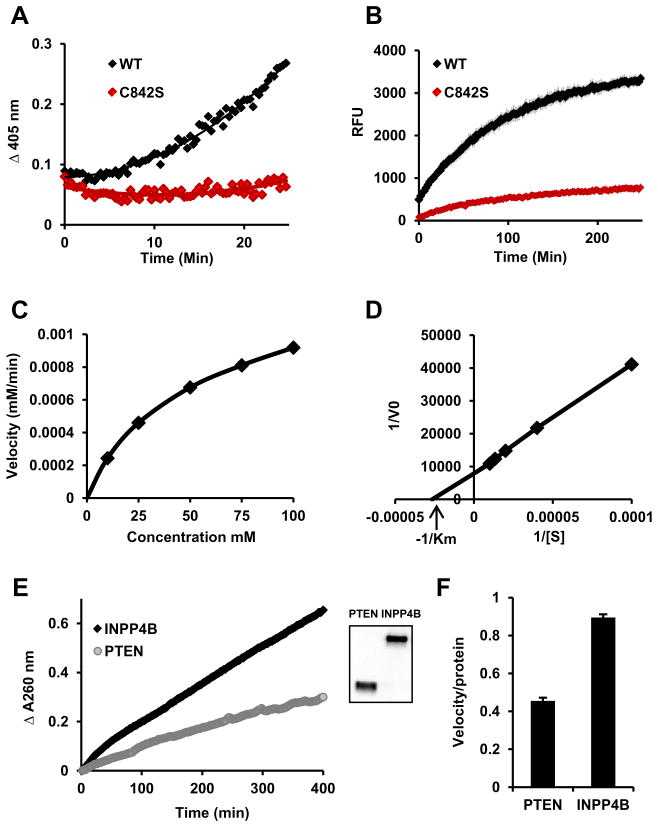
INPP4B has protein tyrosine phosphatase activity. Hek293T cells were transfected with WT or mutant INPP4B in the p3xFLAG-CMV-10 expression vector. Proteins were expressed for 3 days, immunoprecipitated using M2 affinity gel, and eluted with excess 3xFLAG peptide. (A) Twenty-five percent of indicated eluates were incubated with 100 mM pNPP. (B) INPP4B prepared as in (A) was incubated with 200 μM of DifMUP and fluorescent DiFMU accumulation measured (excitation/emission 358/452 nm). (C) 10 mM, 25 mM, 50 mM, 75 mM, and 100 mM of pNPP were incubated with the same amount of INPP4B as in (A) or with reaction buffer as a blank for each concentration. The maximum velocity was measured and plotted against concentration of pNPP. (D) Values from (C) were used to build a Lineweaver–Burk plot. Michaelis constant, km, was calculated using measurements from (C) and (D). (E) p3xFLAG-CMV-10-INPP4B and p3xFLAG-CMV-10-PTEN were expressed and immunoprecipitated as described in materials and methods. Next, 30% of eluate was used for pNPP hydrolysis and 2% for western blot analysis with 3xFLAG antibody M2 (inset). (F) Slopes of the pNPP enzymatic reaction were divided by the relative protein levels as determined by Western blot analysis. Three independently measured velocities were normalized for protein levels and the average ± SEM calculated.

