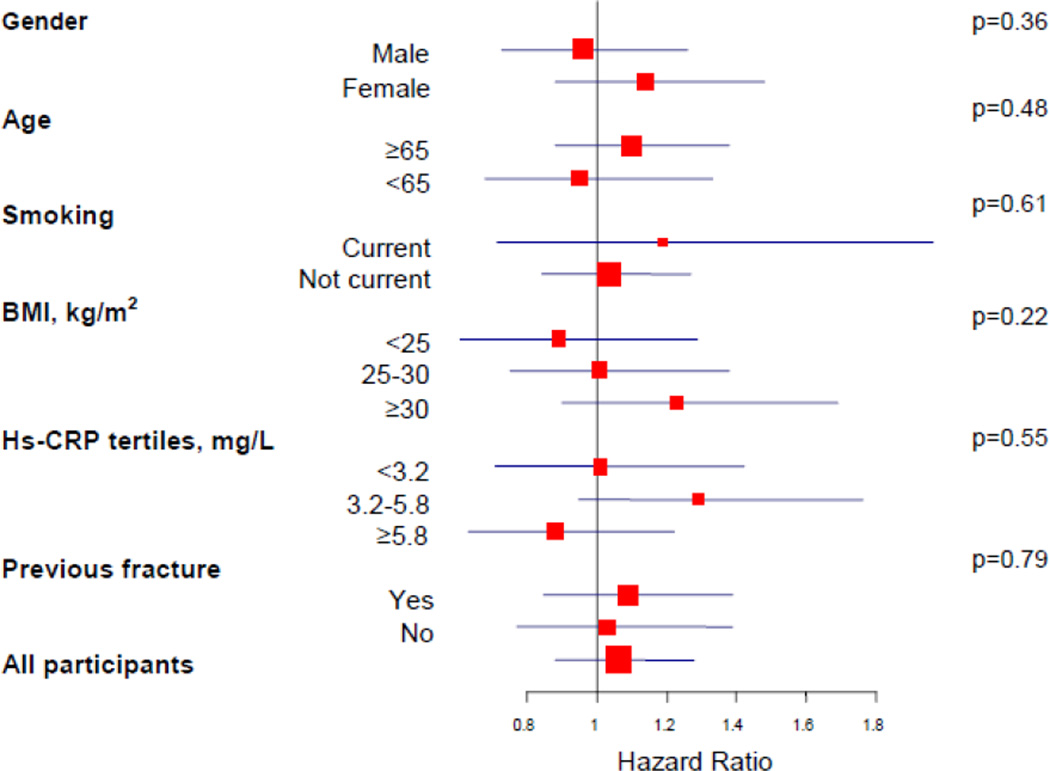
Figure 2. Effect of Rosuvastatin on risk of fracture, according to baseline characteristics of study participants.
Shown are the hazard ratios (red square boxes) for rosuvastatin as compared with placebo. The size of the square box is inversely proportional to the confidence interval (horizontal blue lines). Interaction p values are shown to the right.
Hs-CRP= high sensitivity C-reactive protein

