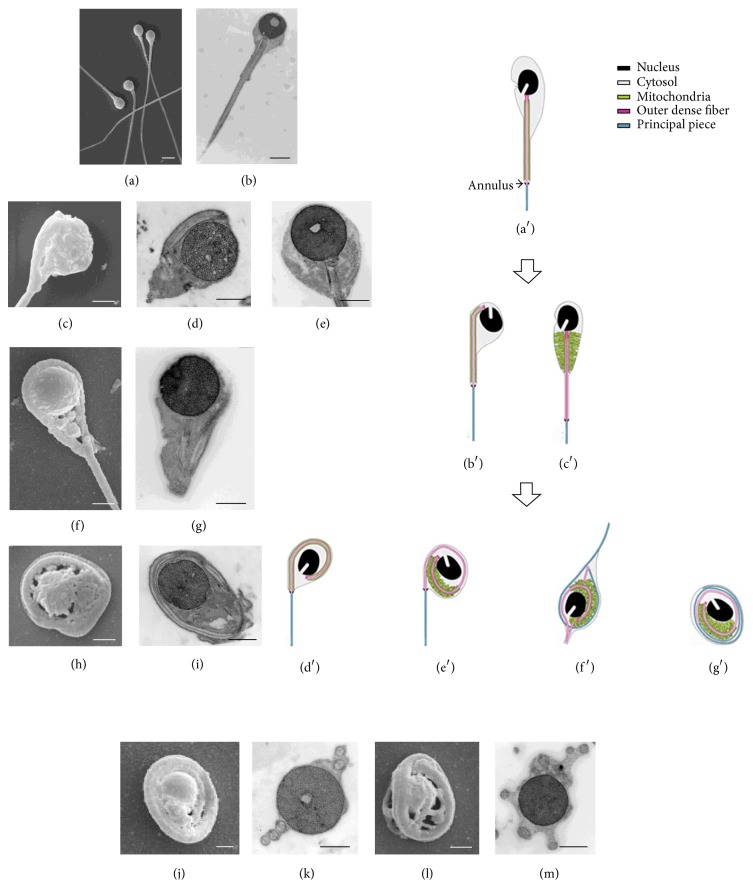
Figure 2.
Comparison of sperm tail coiling in human and animal model. ((a) and (b)) SEM and TEM images of straight tail round-headed human sperm; ((c) and (d)) SEM and TEM samples at starting of tail bending; (e) TEM mitochondria accumulated in the conical neck; ((f) and (g)) SEM and TEM tail once turned around the nucleus; ((h) and (i)) tail turned around the nucleus more than once; ((j), (k), (l), and (m)) SEM and TEM images of coiling many times around the nucleus. (a) White scale bar = 2 μm; (b) black scale bar = 2 μm; ((c), (f), (h), (j), and (l)) white scale bars = 1 μm; ((d), (e), (g), (i), (l), and (m)) black scale bars = 1 μm. ((a′), (b′), (c′), (d′), (e′), (f′), and (g′)) Diagrammatic summary of tail disorganizing process in Gopc−/− spermatozoa (see text for the details), modified from Figure 5 of Suzuki-Toyota et al. 2007 [6]. Reproduced with permission from Society for the Study of Reproduction. Copyright 2007 by the Society for the Study of Reproduction, Inc.

