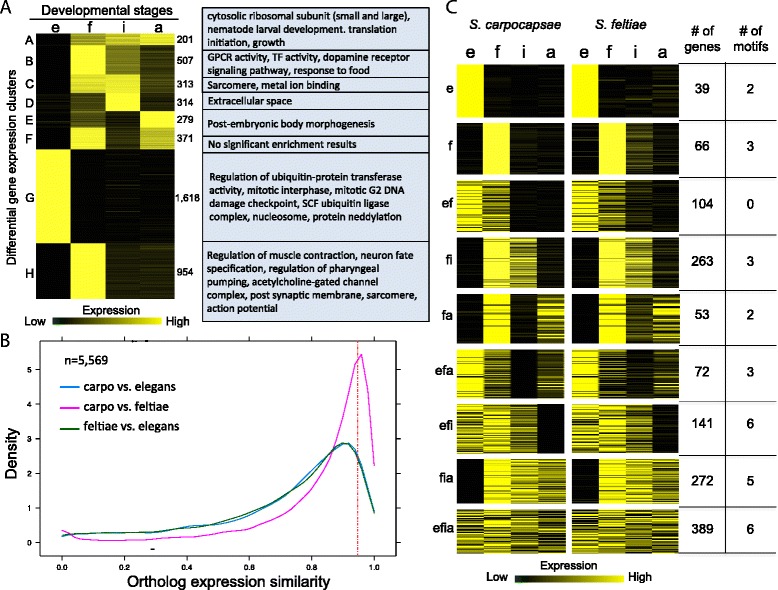
Fig. 3.

a Heat map of 4,557 differentially expressed (DE) genes (FDR < 1 × 10⁻⁵, fold change > 4×) during S. carpocapsae development. Gene Ontology term enrichment analysis was performed on the DE gene sets with Blast2GO (Fisher’s exact test, FDR < 0.01). Gene expression for each stage for each gene was scaled so that the total expression of the row sums to 1. b Plot showing the distribution of gene expression profile similarities for 5,569 1:1:1 orthologs between species pairs during development. Ortholog expression (TPM) during development for each species was treated as a vector, and ortholog expression similarity was determined by calculating the cosine similarity of the vectors, where 1 corresponds to identical expression profiles, and 0 corresponds to divergent expression profiles. Orthologs with conserved stage-specific expression profiles have similarity measures > 0.95. c Heat map showing the ortholog expression profiles of the conserved stage-specific orthologs (cosine similarity > 0.95) in (b) in S. carpocapsae and S. feltiae. Gene expression is scaled so that the total expression across a row sums to 1 as in (a). The number of genes in each gene set and the number of significant non-redundant motifs that were derived from each gene set are shown to the right. e embryonic, f first larval, i infective juvenile, a adult developmental stages
