Fig. 4.

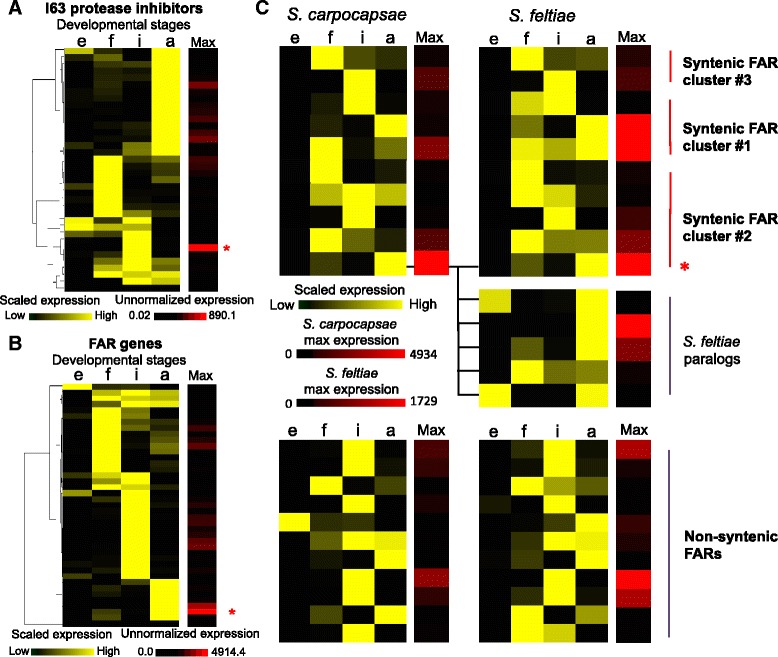
Stage-specific gene expression of FAR proteins and protease inhibitors in S. carpocapsae. Heat map of the scaled gene expression of a 37 I63 protease inhibitors, and b 41 FAR proteins in S. carpocapsae. Expression of each gene was scaled between 0 (minimum expression, black) and 1 (maximum expression, yellow) across the developmental stages, and hierarchically clustered based on the expression profiles. The Max column shows each gene’s maximum non-normalized expression value (FPKM) that was achieved during the time course. Genes that have high expression are in red, while genes that have low expression are in black. The asterisk indicates the gene that has the highest expression. c Gene expression of 22 1:1 orthologous FAR genes across three syntenic FAR clusters and the non-syntenic FARs were compared between S. carpocapsae and S. feltiae. For each FAR ortholog, gene expression was scaled between 0 (minimum expression) and 1 (maximum expression) across the developmental stages. The Max column shows the maximum gene expression levels of the FARs in S. carpocapsae and S. feltiae. Five S. feltiae paralogs of the bottom-most ortholog in FAR syntenic cluster #2 are shown separately beneath the heat map. e embryonic, f first larval, i infective juvenile, a adult developmental stages
