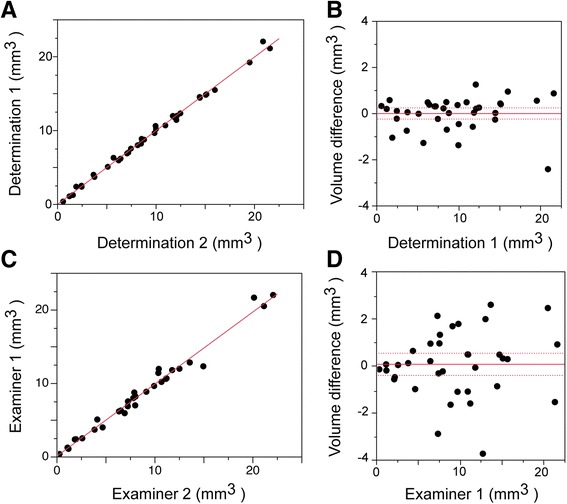
Fig. 4.

Intra- and inter-observer variability of volume measurement by ultrasound imaging. Intra-observer variation (a, b). a Linear correlation plot of two independent sets of volume measurements, performed (blinded) by a single observer (data from Figs. 2 and 3 image sets). The correlation coefficient, r2 = 0.995. b Bland-Altman plot of the data from (a). Dashed lines correspond to the 95 % confidence interval. The mean deviation of individual measurements was 0.8 % (n = 36). Inter-observer variation (c, d). c Linear correlation plot of two independent sets of volume determinations, performed (blinded) by two separate examiners (data from Figs. 2 and 3 image sets). The correlation coefficient, r2 = 0.945. d Bland-Altman plot of the data from (c). Dashed lines correspond to the 95 % confidence interval. The mean deviation of individual measurements was 3.0 % (n = 32).
