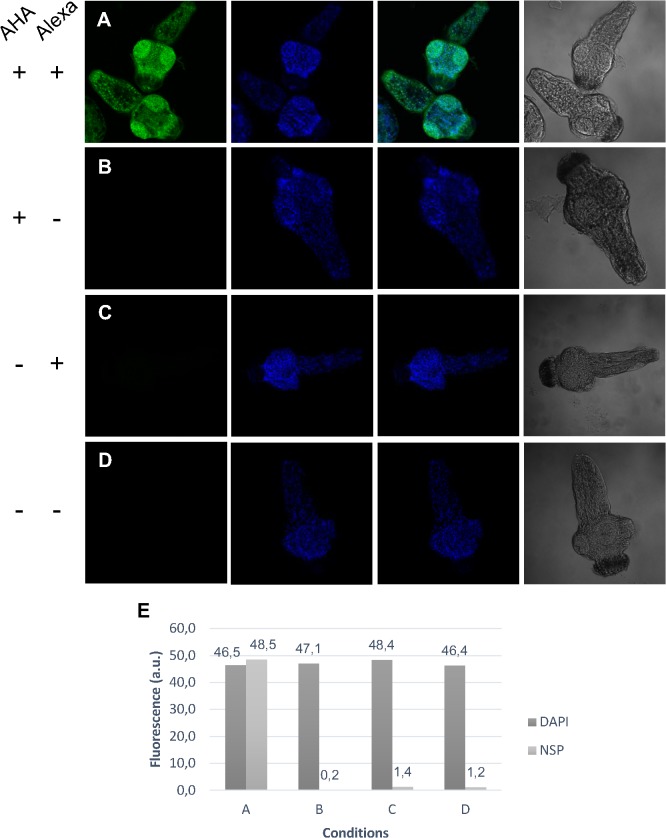
Fig 2. In toto visualization of proteins synthesized by E. granulosus PSCs induced to strobilar development.
(A) NSPs were specifically visualized in the presence of AHA and Alexa Fluor 488 Alkyne. The other images represent the DAPI nuclei staining, the bright field merges of DAPI and Alexa Fluor 488 antibody staining and the bright field images. (B) AHA+/Alexa-, (C) AHA-/Alexa+ and (D) AHA-/Alexa- did not show significant fluorescence or autofluorescence (400x). (E) The quantification of NSP (Alexa Fluor 488) and nucleic acid regions (DAPI) fluorescence. a.u., arbitrary units.

