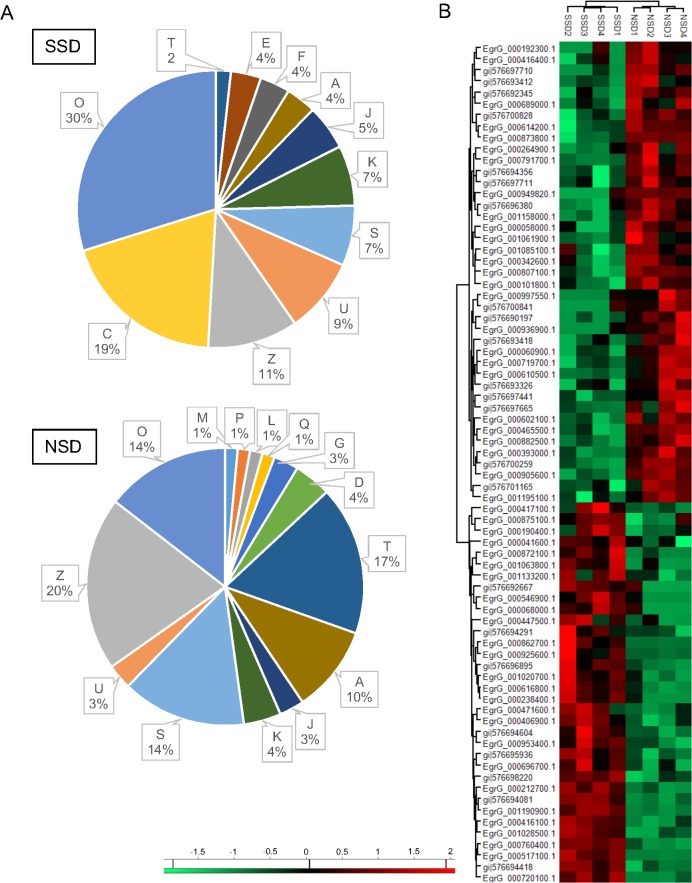
Fig 5. Comparative analysis of NSPs from E. granulosus PSCs after the induction of strobilar development.
(A) Functional categories of total identified NSPs. Percentages of identified proteins in each functional category are indicated. (O) Post-translational modification, protein turnover, and chaperones; (C) Energy production and conversion; (Z) Cytoskeleton; (U) Intracellular trafficking, secretion, and vesicular transport; (S) Function unknown; (K) Transcription; (J) Translation, ribosomal structure and biogenesis; (A) RNA processing and modification; (F) Nucleotide transport and metabolism; (E) Amino acid transport and metabolism; (T) Signal transduction mechanisms; (D) Cell cycle control, cell division, chromosome partitioning; (G) Carbohydrate transport and metabolism; (Q) Secondary metabolites biosynthesis, transport, and catabolism; (L) Replication, recombination and repair; (P) Inorganic ion transport and metabolism; (M) Cell wall/membrane/envelope biogenesis. The distribution of level 3 biological processes for SSD and NSD-exclusive and up-regulated proteins. (B) A heat map from NSPs with high (red) or low (green) expression levels between the SSD and NSD groups.

