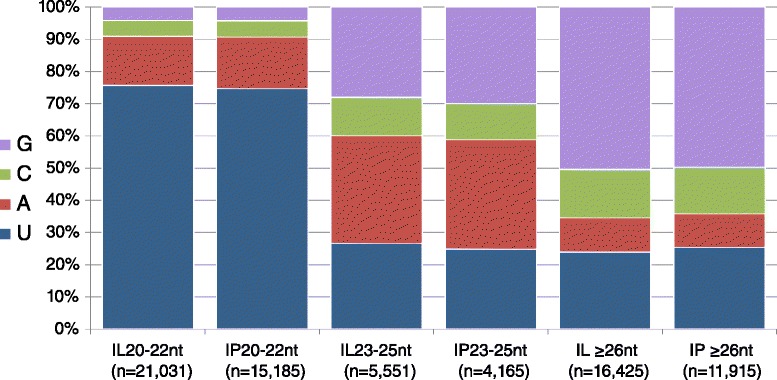
Fig. 4.

Relative nucleotide frequency of the 5′ end of Pst-sRNAs. Stacked bar charts displaying the relative frequency of each nucleotide in the first position of three length classes: 20–22 nt, 23–25 nt, and ≥26 nt. Length classes were chosen empirically from the three prominent peaks shown in Fig. 3. Bars designated ‘IL’ correspond to sRNAs from the Infected Louise library, and ‘IP’ to the Infected Penawawa library. All bars add to 100 %
