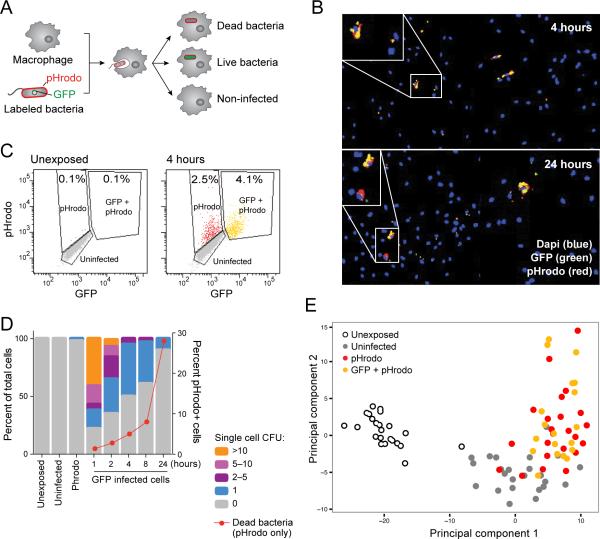
Figure 1. Heterogeneous outcomes of BMM-Salmonella encounters are captured by single-cell expression analysis.
(A) Schematic representation of the experimental model, using BMMs infected with pHrodo-labeled, GFP-expressing S. typhimurium. (B) Representative images of mouse BMMs exposed to S. typhimurium reveals heterogeneity in infection phenotype including uninfected macrophages, and infected macrophages containing live (yellow) or dead (red) bacteria at early (4 hours; top) and late (24 hours; bottom) time points. (C) FACS analysis of fluorescently labeled populations (unexposed-left, exposed for 4 hours-right). (D) CFU enumerated from individual fluorescently labeled macrophages. Unexposed, uninfected and pHrodo+,GFP– cells had no or minimal surviving bacteria. GFP+ cells contain different numbers of cells over time (left y-axis). The red line indicates the percentage of pHrodo-only infected cells demonstrating the increase in the number of dead bacteria over time (right Y axis). (E) Single macrophages have distinct transcriptional responses depending on infection phenotype. 96 single cells from (C) were analyzed by RNA-seq and principle component analysis. Shown are the first two principal components (PC1 and PC2, 5 and 3 percent of the total variation respectively, Table S1B).

