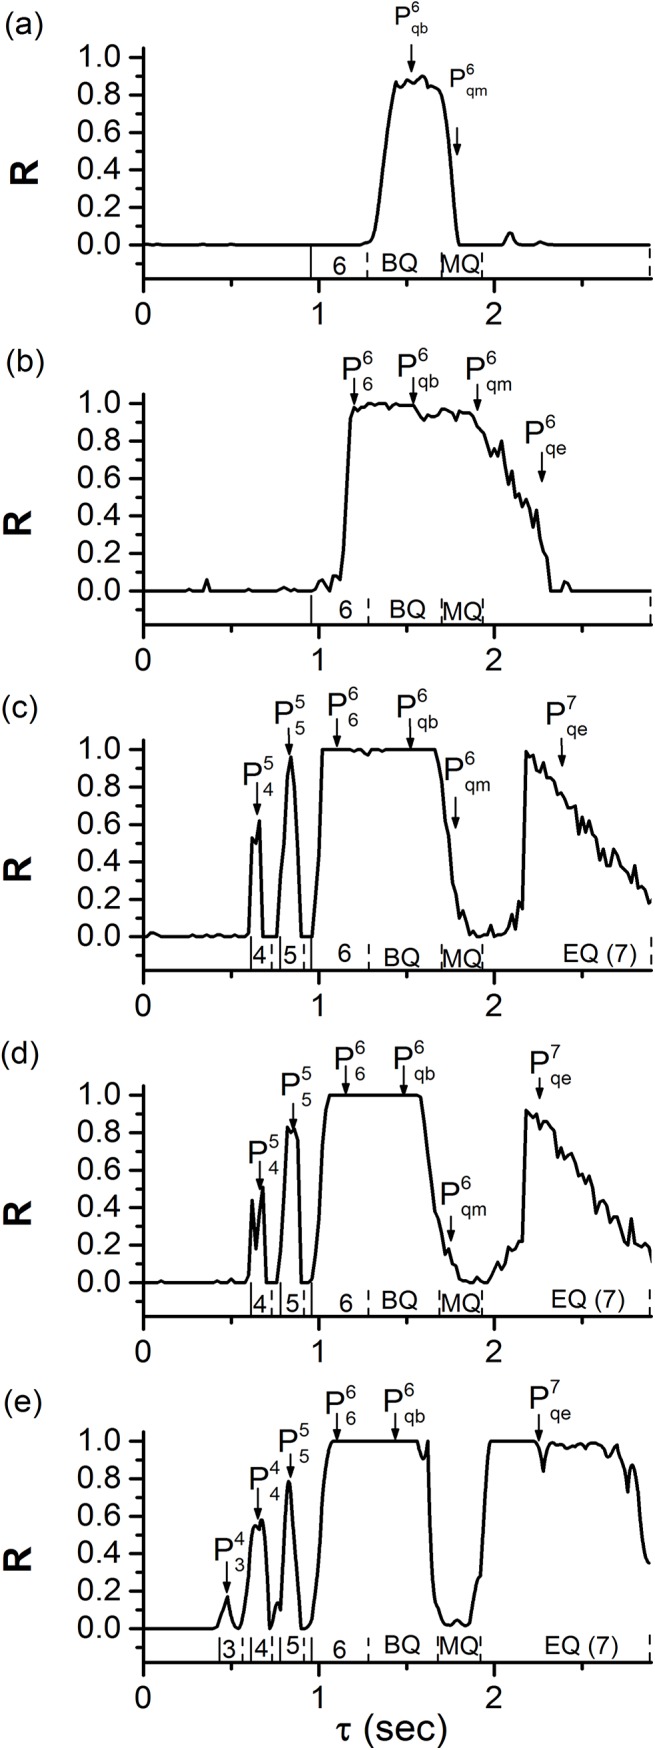
Fig 9. Time-delay (τ)-induced single or multiple synchronous behaviors.

The changes of R values with respect to τ at different coupling strengths (g 1,g 2). The numbers 3, 4, 5, 6, and 7 represent burst with 3, 4, 5, 6, and 7 spikes, respectively. BQ, MQ, and EQ represent the beginning, middle, and end of the quiescent state of period-6 bursting, respectively. (l = 3, 4, 5 or 6, k = 4, 5 or 6) and (k = 6 or 7, “c” represents “b”, “m” or “e”, respectively) represent synchronous bursting patterns shown in Fig 7. (a) Single synchronous behaviors (0.01 nS, 0.02 nS); (b) (0.01 nS, 0.2 nS); (c) (0.2 nS, 0.4 nS); (d) (0.2 nS, 0.6 nS); (e) (0.6 nS, 0.9 nS). Multiple synchronous behaviors are shown in Figs (b)-(e).
