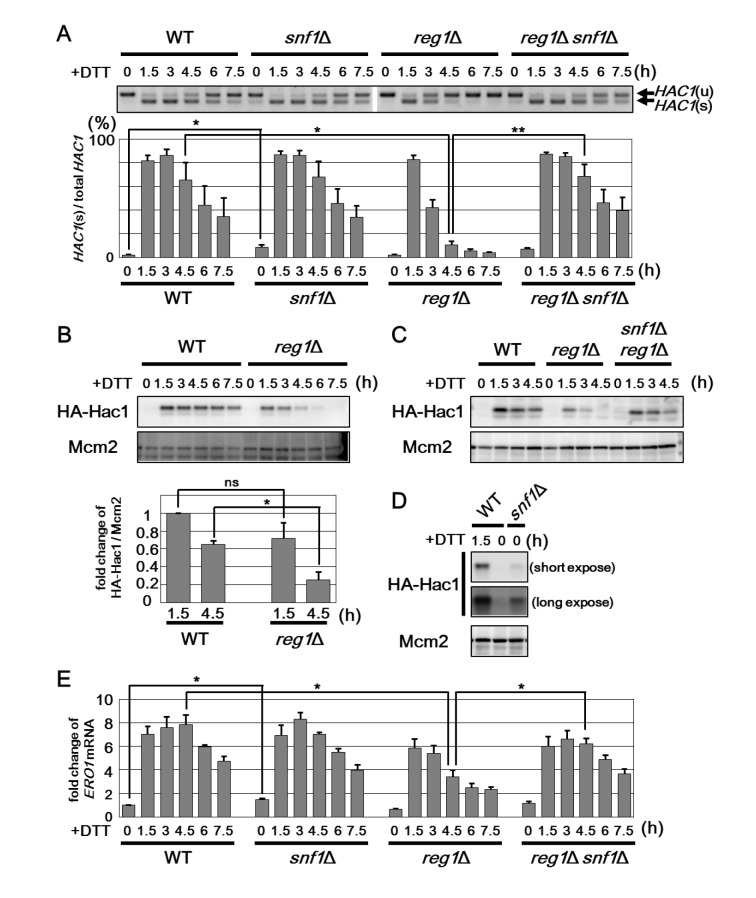
Fig 3. Snf1 negatively regulates the UPR pathway.
(A) Splicing of HAC1 mRNA in the snf1Δ and reg1Δ mutants. Wild-type (WT) and snf1Δ, reg1Δ and, snf1Δ reg1Δ mutant strains were grown at 25°C until exponential phase and treated with 4 mM dithiothreitol (DTT) for the indicated time. Total RNAs prepared from each strain were subjected to RT-PCR of HAC1. Positions of unspliced HAC1 (HAC1 u) and spliced HAC1 (HAC1 s) are indicated. The data show the mean of HAC1 s/(HAC1 u+ HAC1 s) with SEM (n = 4). *P < 0.05 and **P < 0.01 as determined by Student’s t-test. (B) Expression of Hac1 in the reg1Δ mutants. Wild-type (WT) and reg1Δ mutant strains harboring HA-tagged HAC1 were grown at 25°C until exponential phase and treated with 4 mM dithiothreitol (DTT) for the indicated time. Extracts prepared from each strain were immunoblotted with anti-HA (HA-Hac1) and anti-Mcm2 antibodies. The intensities of HA-Hac1 were measured and normalized to the Mcm2 level. The values are plotted as the fold change from wild-type cells at 1.5 h after DTT addition. The data show mean ± SEM (n = 3). *P < 0.05 as determined by Student’s t-test. ns, not significant. (C) Expression of Hac1 in the reg1Δ snf1Δ mutants. Wild-type (WT) and reg1Δ and reg1Δ snf1Δ mutant strains harboring HA-tagged HAC1 were grown at 25°C until exponential phase and treated with 4 mM dithiothreitol (DTT) for the indicated time. Immunoblot was performed as described in (B). (D) Expression of Hac1 in the snf1Δ mutants. Wild-type (WT) and snf1Δ mutant strains harboring HA-tagged HAC1 were grown at 25°C until exponential phase and treated with 4 mM dithiothreitol (DTT) for the indicated time. Immunoblot was performed as described in (B). (E) Expression of ERO1 gene in the snf1Δ and reg1Δ mutants. Wild-type (WT) and snf1Δ, reg1Δ, and reg1Δ snf1Δ mutant strains were grown at 25°C until exponential phase and treated with 4 mM dithiothreitol (DTT) for the indicated time. The mRNA levels were quantified by qRT-PCR analysis, and relative mRNA levels were calculated using ACT1 mRNA. The data show mean ± SEM (n = 3). *P < 0.05 as determined by Student’s t-test.

