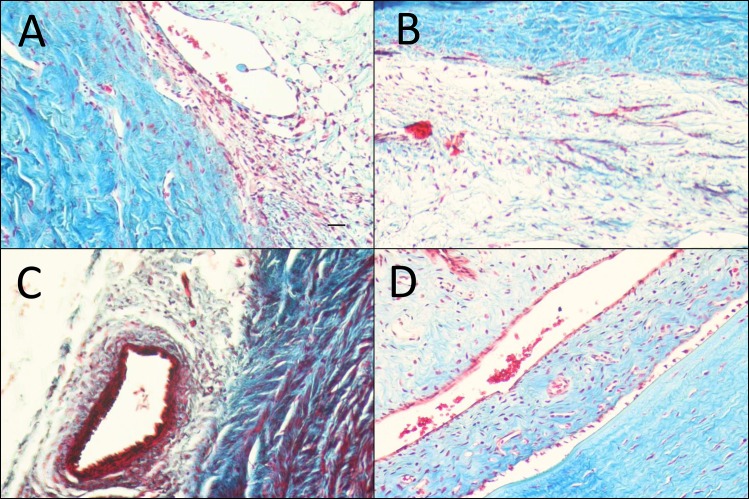
Fig 4. Masson’s Trichrome stained representative sections near implants site taken from POD 12, Masson’s Trichrome (magnification 10x, black scale bars = 100 μm).
(A) Saratin/Ilomostat; (B) Saratin/Bevacizumab/Ilomostat; (C) BSS; (D) MMC (all representative, come from areas of roughly the same location in relation to tube placement)

