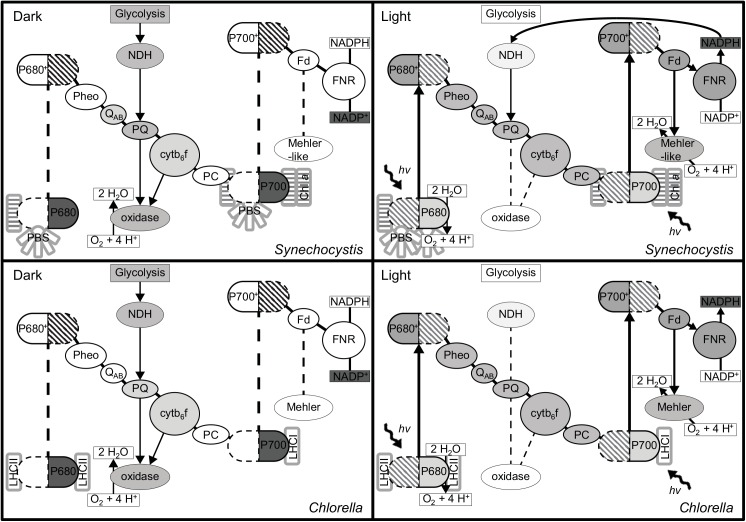
Fig 4. Schematic overview of the redox state of the components of the photosynthetic electron transport chain.
Schematic overview of the redox state of the photosynthetic electron chain in dark (left) and light (right) for Synechocystis (top) and Chlorella (bottom). The grey color indicates the level of reduction (the darker the more reduced) of the different intermediates or, in case of P680, P700 and NADP(H), the predominant species.

