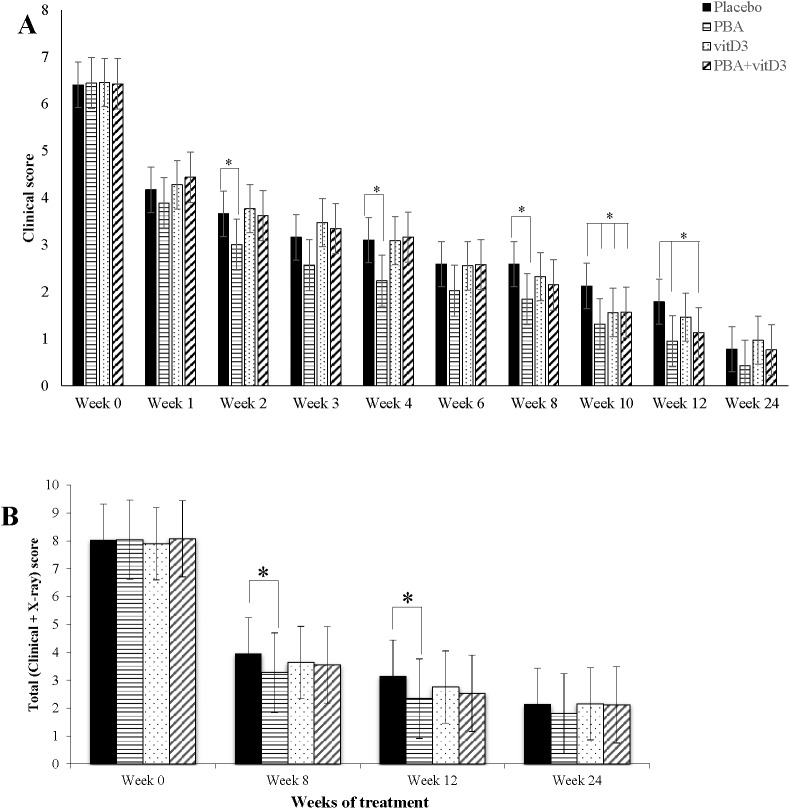
Fig 7. Mean TB score in TB patients in the four intervention arms during the study period.
Standard deviation is shown as vertical bar. Comparisons of intervention arms are made with the placebo arm with statistically significant differences being shown in asterisks. The PBA-group demonstrated significantly lower TB scores than the placebo group at week 2, 4, 8, 10 and 12. At week 10 all three intervention groups showed lower scores than the placebo group. Multivariate regression analysis was utilized for comparison of mean effect of clinical scores in the different intervention groups.

