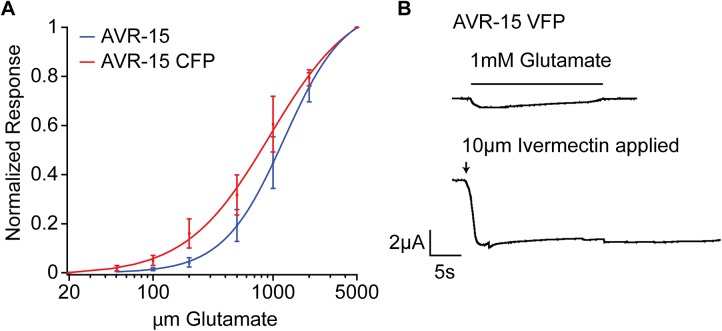
Fig 4. Fluorophore-tagged AVR-15 behaves electrophysiologically similar to untagged AVR-15 in Xenopus laevis oocytes.
(A) Dose–response curve with the normalized maximal response on the y-axis plotted against the glutamate concentration on a log scale on the x-axis. The curve represents the average of three oocytes for the untagged AVR-15 and four oocytes for the fluorescently tagged AVR-15; error bars ± 1 SEM. Oocytes were clamped at –80 mV unless otherwise indicated. (B) An oocyte treated with 1mM glutamate and subsequently with 10μM IVM. The arrow indicates when IVM was applied (exposure to IVM was continuous from this point on) and the bar indicates when glutamate was applied. This response is similar to the untagged AVR-15 response as shown in Dent, Davis, and Avery [33]. CFP = Cerulean Fluorescent Protein; VFP = Venus Fluorescent Protein.

