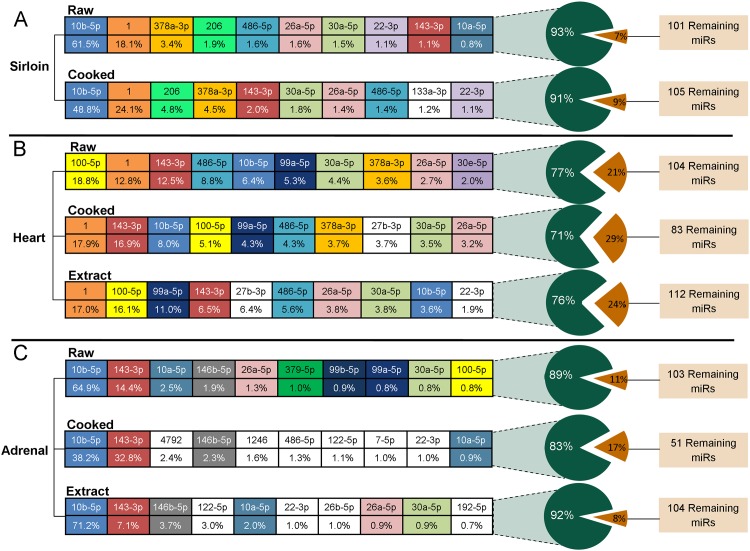
Fig 4. miRNA Profiles of Raw and Prepared Tissues.
The average percentage contribution to the total human-annotated miRNA profile of the 10 most abundant miRNAs in each tissue and process group. Raw tissue miRNAs were each assigned a unique color. All miRNAs given a white background were present among the 10 most abundant miRNAs in cooked or dried extract samples but not the corresponding raw tissue.

