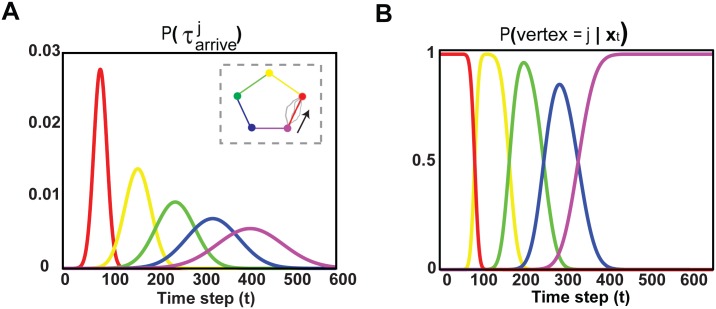
Fig 1. Encoding the order of policies in sequential movements.
A: Probability distribution of time to arrive at vertex j starting from the original state at time t = 0 and visiting all the precedent vertices. Each color codes the segments and the vertices of the pentagon as shown in the right inset. The pentagon is copied counterclockwise (as indicated by the arrow) starting from the purple vertex at t = 0. The gray trajectories illustrate examples from the 100 reaches generated to estimate the probability distribution of time to arrive at vertex k given that we started from vertex k − 1, . B: Probability distribution P(vertex = j|x t), which describes the probability to copy the segment defined by the two successive vertices j − 1 and j at state x t. This probability distribution is estimated at time t = 0 and when arriving at the next vertex, we condition on completion, and P(vertex = j|x t) is re-evaluated for the next vertices.

