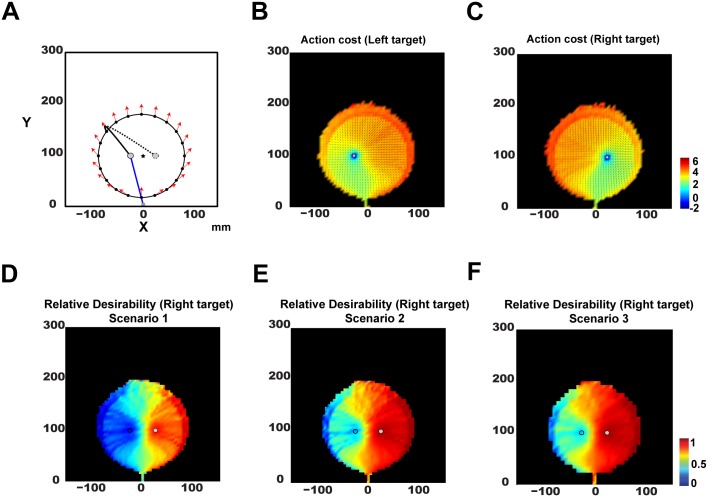
Fig 3. Relative desirability function in reaching movements with multiple potential targets.
A: A method followed to visualize the relative desirability function of two competing reaching policies (see results section for more details). B: Heat map of the log-transformed action cost for reaching the left target (gray circle) starting from different states. Red and blue regions correspond to high and low cost states, respectively. The black arrows describe the average hand velocity at a given state. C: Similar to panel B but for the right target. D: Heat map of the relative desirability function at different states to reach to the right target, when both targets provide the same amount of reward with equal probability. E: Similar to D, but for a scenario in which the right target provides the same amount of reward with the left one, but with 4 times higher probability. F: Similar to D, but for a scenario in which the mean reward provided by right target is 4 times higher than then one provided by the left target.

