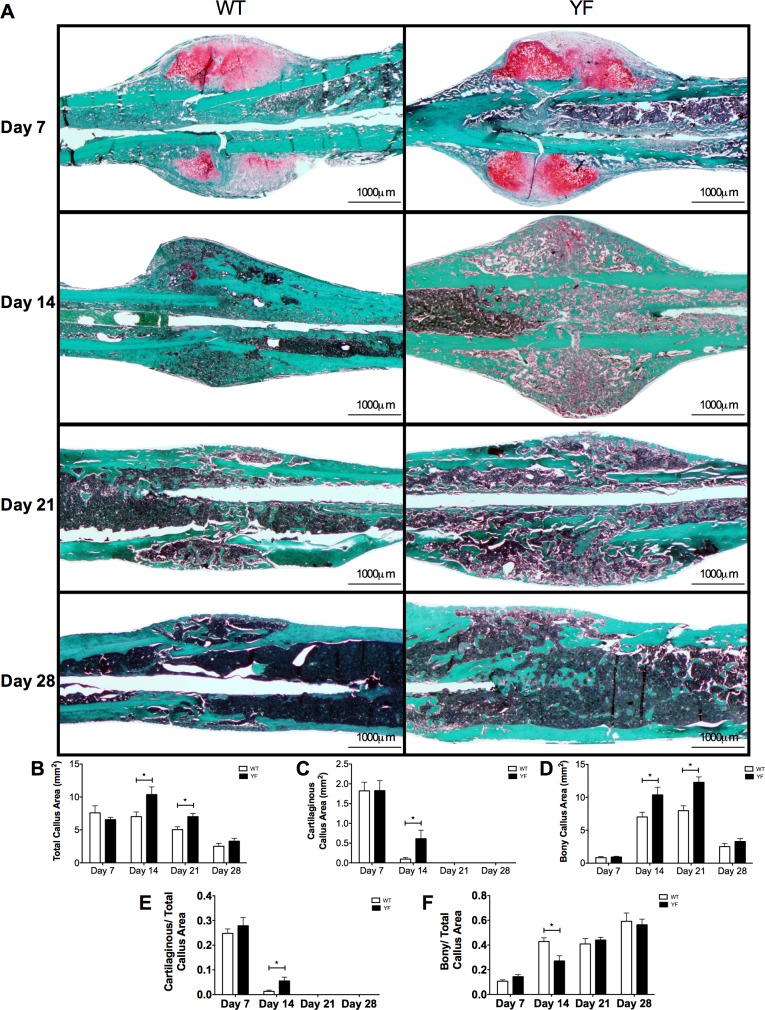
Fig 3. Increased cartilaginous and bony matrix in remodeling fracture calluses of YF mice.
For histological analysis, mid-sagittal sections of fractured femora were stained with Safranin O and fast green and quantitated by static histomorphometry. A. Representative sections at 7, 14, 21, and 28 days post-fracture. Bar charts show B. Total callus area C. Cartilaginous matrix area D. Bony matrix area. E. Ratio of cartilaginous matrix area over total callus area F. Ratio of bony matrix area over total callus area. n = 5–6, *p<0.05 vs. WT.

