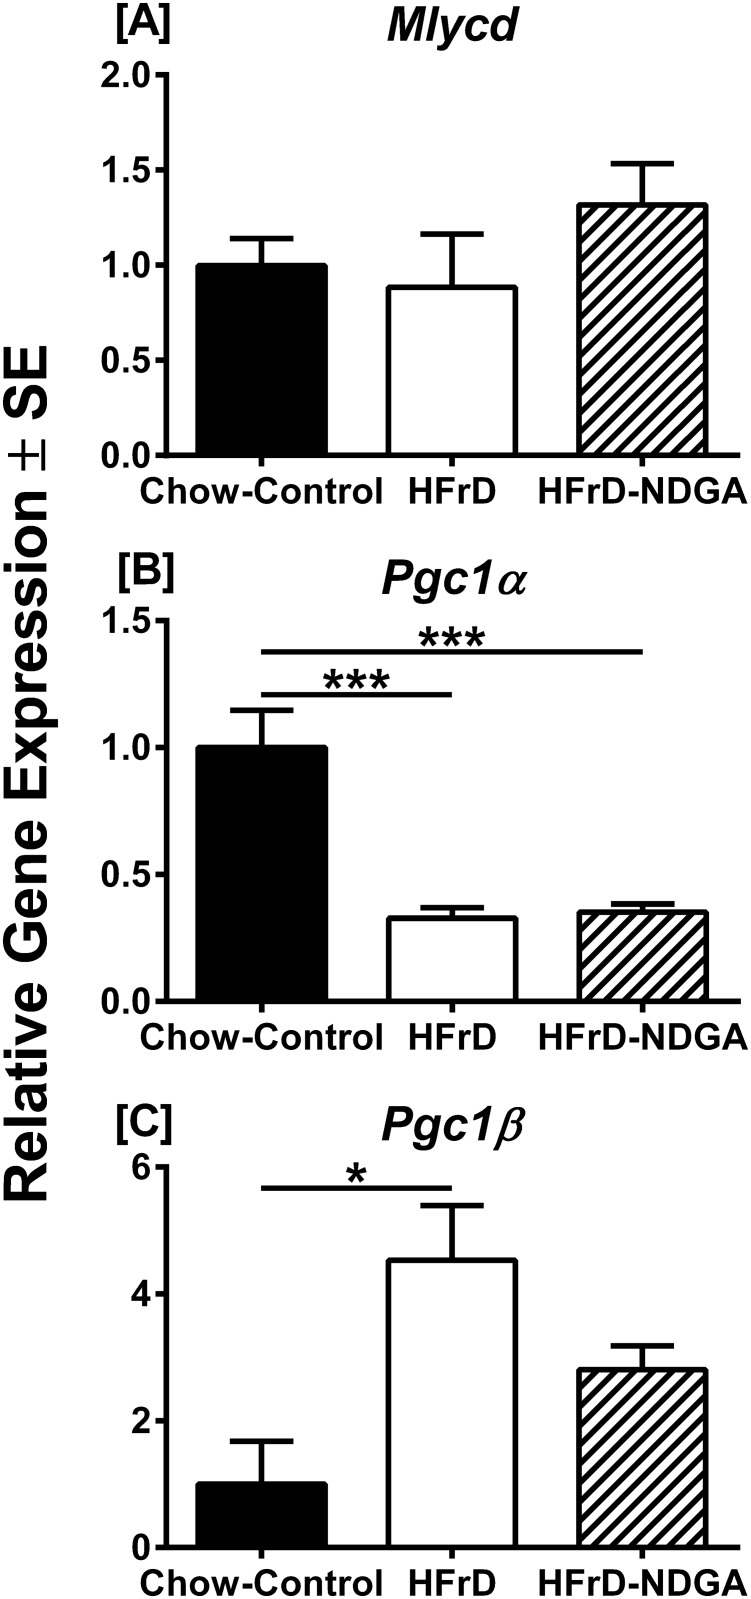
Fig 4. Effect of NDGA treatment on expression of Mlycd, Pgc-1α and Pgc-1β.
Quantitative RT-PCR of RNA from livers of chow-fed rats, rats fed an HFrD for 8 weeks and rats fed an HFrD for 8 weeks and subsequently treated with NDGA at a dose of 125 mg/kg BW twice a day by oral gavage. Results are mean ± SE of 3 independent RT-PCR experiments for each gene within each group (normal chow, n = 3, high fructose n = 4, high fructose with NDGA n = 4). Data are presented relative to 36B4 in the same samples, and relative mRNA levels were determined by qRT-PCR using the comparative CT method. * P<0.05; ** P<0.01; *** P<0.001. Raw data and statistics are listed in S1 Dataset.

