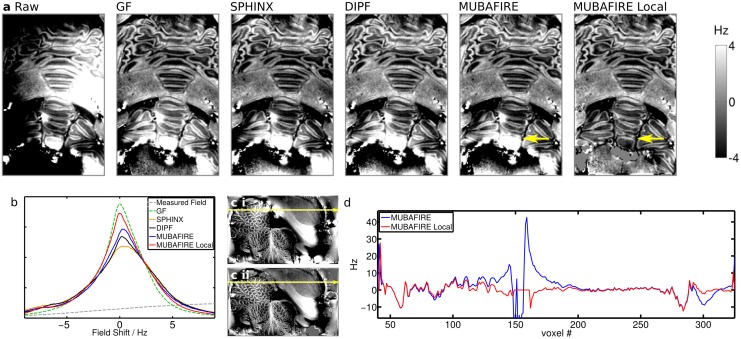
Fig 9. Results of the BFR algorithms applied on measurement b) (post mortem at 9.4T).
(a) shows a frontal sample slice of the VOI, from left to right: raw, GF, SPHINX, DIPF, MUBAFIRE, MUBAFIRE Local; yellow arrows indicate differences; (b) histogram comparison; (c i-ii) position of the line plot in MUBAFIRE (c i) and MUBAFIRE Local (c ii) corrected slice; (d) line plot.

