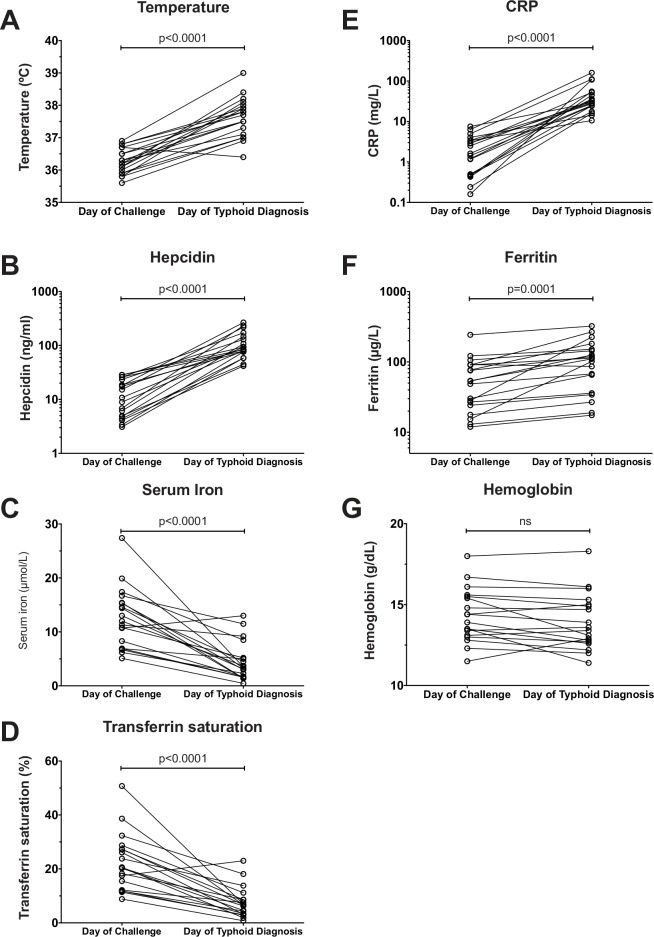
Fig 1. Changes in hepcidin, iron and inflammatory indices between baseline–the day of typhoid challenge–and the day of typhoid diagnosis.
Serum samples were available from both day of typhoid challenge and day of typhoid diagnosis from 19 individuals from Study A (placebo arm of vaccine/typhoid challenge study). (A) temperature, (B) hepcidin, (C) serum iron, (D) transferrin saturation, (E) CRP, (F) ferritin and (G) hemoglobin were measured on the day of challenge and day of typhoid diagnosis. P-values represent results of paired t tests based on geometric means for hepcidin (baseline, 10.4 ng/mL [95% CI: 7.1–15.3]; diagnosis, 98.2 ng/mL [75.9–126.9]), ferritin (baseline, 46.3 μg/L [30.8–69.8]; diagnosis, 86.4μg/L [56.9–131.0]) and CRP (baseline: 1.46 mg/L [0.84–2.54]; diagnosis, 34.1 mg/L [24.2–48.2]), and arithmetic means for temperature (baseline, 36.3°C [36.1–36.5]; diagnosis, 37.6°C [37.3–37.9]), serum iron (baseline, 12.6 μmol/L [9.9–15.3]; diagnosis, 4.4 μmol/L [2.7–6.1]), transferrin saturation (baseline, 22.3% [17.2–27.4]; diagnosis, 7.4% [4.7–10.2]) and hemoglobin (baseline, 14.3 g/dL [13.6–15.1]; diagnosis 13.9 g/dL [13.1–14.8]).

