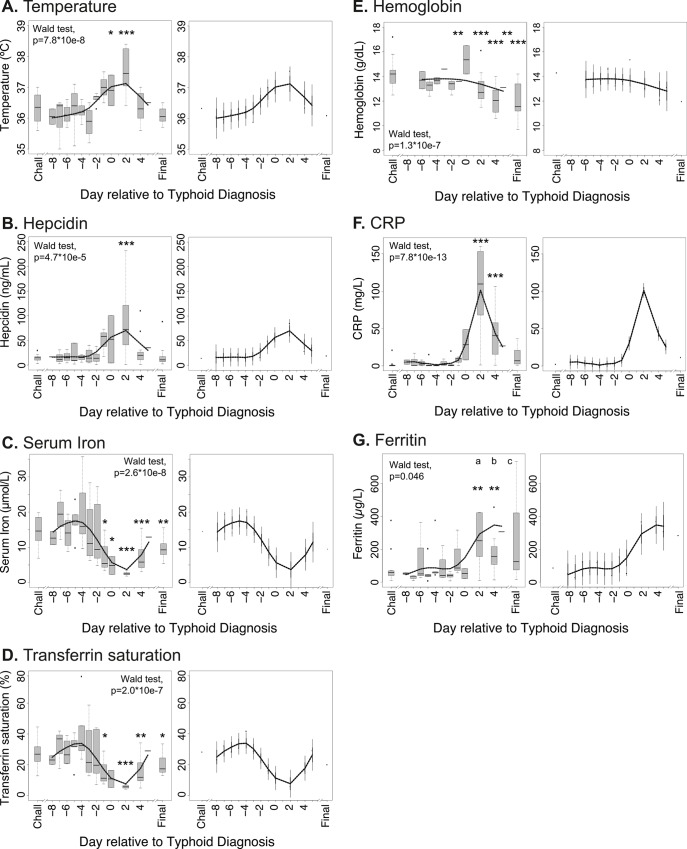
Fig 2. Kinetics of perturbations in hepcidin, iron and inflammatory parameters in individuals diagnosed with typhoid infection following experimental Salmonella Typhi challenge.
(A) Temperatures, (B) serum hepcidin concentrations, (C) serum iron, (D) transferrin saturations, (E) hemoglobin, (F) CRP, and (G) ferritin concentrations were measured in 13 individuals from Study B who received typhoid diagnosis following challenge with Salmonella Typhi. Analyte values are plotted relative to the day of typhoid diagnosis, TD = day 0; since not all individuals were diagnosed on the same day post-challenge, baseline samples from the day of challenge (Chall) are considered together, as are data from the final day 14 visit (Final). (Left-hand panels) Data available from each individual for each day were plotted using box and whiskers, representing median values and interquartile ranges (IQR); whiskers represent the data point occurring furthest from the first or third quartile but still within 1.5*IQR of the quartile; outliers (further than 1.5*IQR from the quartile) are shown as isolated data points. Smoothed curves were also interpolated from the mean data for each day and overlaid on the plots. The Wald test was employed after fitting linear mixed effects models to test the null hypothesis that there is no difference between parameter values between days. Pairwise differences between baseline values on the day of typhoid challenge (Chall) and other days were examined by t-tests after accounting for subject-specific variability. Significant perturbations from baseline are indicated with asterisks (*p<0.05, **p<0.01, ***p<0.001). For ferritin, outliers at (a) 1014.07 μg/L and 1075.24 μg/L, (b) 2433.54 μg/L, and (c) 1008.87 μg/L are beyond the y-axis limits and not depicted on the figure, but are included in the analysis. (Right-hand panels) Smoothed interpolated curves as described above, but depicting 95% pointwise prediction intervals (thick error bar) and conservative simultaneous Bonferroni bounds (thin error bar) of the interpolated curves.

