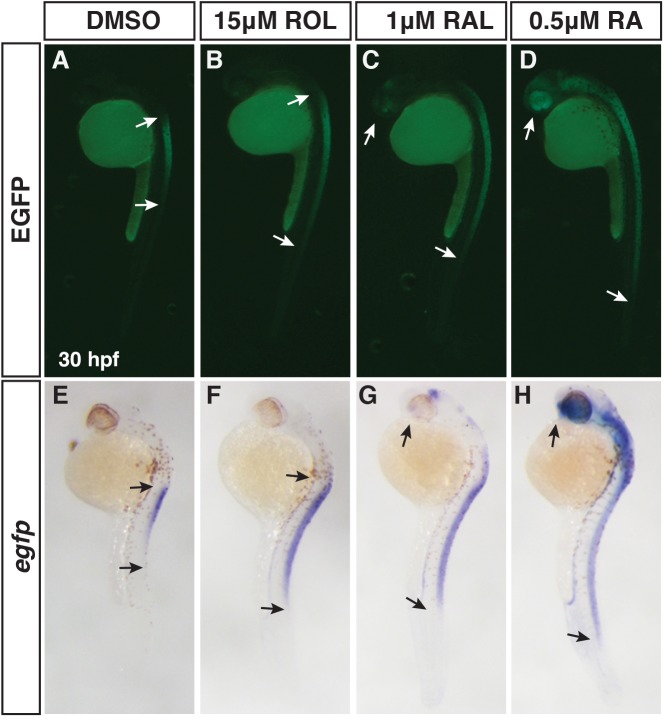
Fig 6. Differential abilities of ROL, RAL and RA to promote RA signaling.
(A-D) EGFP fluorescence in Tg(12XRARE-ef1a:EGFP) sk72 embryos after treatment with 15 μM ROL, 1 μM RAL, and 0.5 μM RA beginning at 24 hpf. (E-H) ISH for egfp expression in Tg(12XRARE-ef1a:EGFP) sk72 embryos after treatment with 15 μM ROL, 1 μM RAL, and 0.5 μM RA beginning at 24 hpf. Arrows indicate the boundaries of expression. Views are lateral with dorsal right and anterior up.

