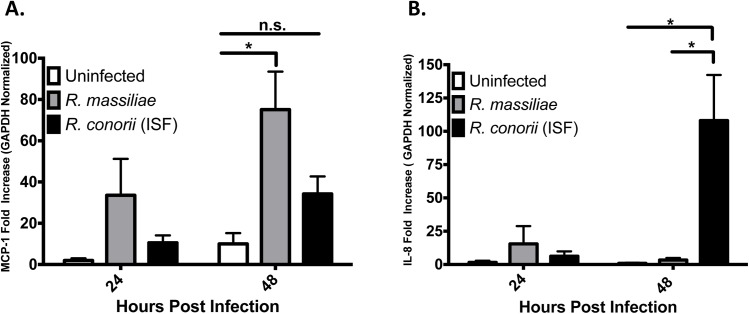
Fig 2. R. massiliae induced upregulation of MCP-1 mRNA levels and R. conorii (ISF) induced IL-8 mRNA levels in HMEC-1 cells.
Real-time quantitative PCR analysis of the expression of MCP-1 mRNA (A) and IL-8mRNA (B) in HMEC-1 cells infected at an MOI of 5. Bar graphs indicate the average and standard error of three independent experiments. White bars represent uninfected cells, grey bars represent R. massiliae- infected cells, and R. conorii (ISF)-infected cells are represented by black bars. *, p <0.05.

