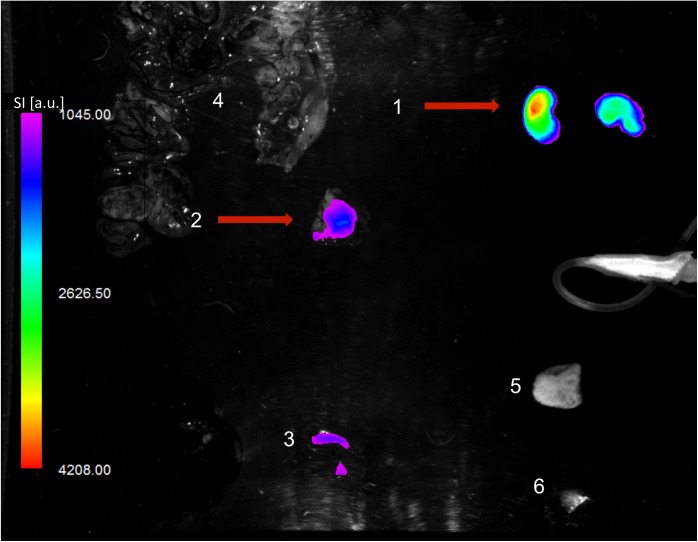
Fig 2. Ex vivo OI analysis of explanted main organs.
Fusion of color-coded fluorescence and anatomic white-light image. In accordance with the in vivo results, highest OI signal is observed in the kidneys (1) and the tumor (2) (red arrows). As a blood pool organ, the spleen (3) demonstrates relatively high probe accumulation. Only subtle OI signal is detected in the gut (4), the skin (5), and the thigh muscle (6). OI signal intensity (SI) is displayed in arbitrary units (a.u.).

