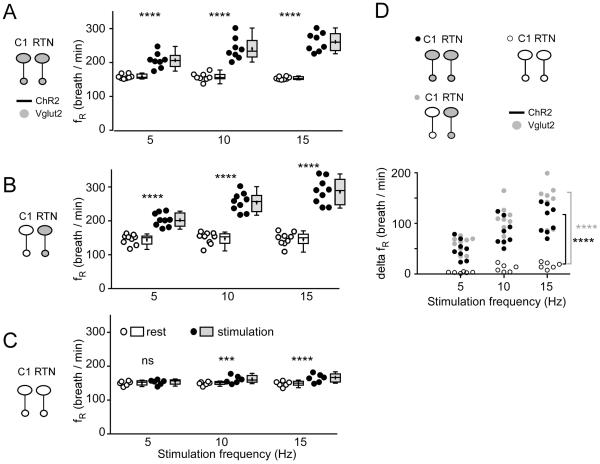
Figure 2. Optogenetic activation of RTN and C1 neurons: effect on breathing frequency.
A. Breathing frequency (fR) at rest (open circles represent individual data points and box and whisker plots summarize each data set with means indicated by crosses) and during photostimulation (black circles and gray boxes) in control mice. In these mice Vglut2 is expressed by both types of ChR2-tranasduced neurons (C1 and RTN). B. Breathing frequency (fR) at rest (open circles and boxes) and during photostimulation (black circles and gray boxes) in mice in which ChR2-transduced RTN express Vglut2 but ChR2-transduced C1 cells do not express Vglut2. C. Breathing frequency (fR) at rest (open circles and boxes) and during photostimulation (black circles and gray boxes) of neurons in mice in which neither C1 nor RTN ChR2-transduced neurons express Vglut2. D. change in breathing frequency produced by photostimulating ChR2-transduced neurons in the three mice groups.
In A-C *** P = 0.0003 and **** P < 0.0001 (post hoc Sidak multiple comparison between rest and stimulation). In D, **** P < 0.0001 (between group 3 and groups 1 or 2 at 15 Hz by Tukey’s post hoc multiple comparison test between groups, see Table 4 for q and P values).

