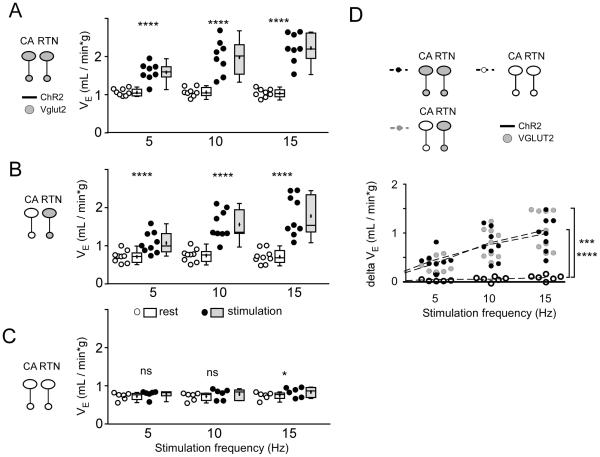
Figure 4. Optogenetic activation of RTN and CA neurons: effect on minute volume (VE).
The data is presented as in Figure 2. A-C. Minute volume (VE = fR × VT) at rest (open circles and boxes) and during photostimulation (black circles and gray boxes) in control mice (A, group 1), in mice in which ChR2-transduced RTN express Vglut2 but ChR2-transduced C1 cells do not express Vglut2 (B, group 2) and in mice in which neither CA nor RTN ChR2-transduced neurons express Vglut2 (C, group 3). D. changes in VE produced by photostimulating ChR2-transduced neurons in the three mice groups.
In A-C * P = 0.0161 and **** P < 0.0001 (Sidak post hoc multiple comparisons). In D, *** P = 0.0002 and **** P < 0.0001 (between group 3 and groups 1 or 2 at 15 Hz by Tukey’s post hoc multiple comparison test between groups, see Table 4 for q and P values).

