

Abstract
Background and Objectives
Optical microangiography (OMAG) is a noninvasive technique capable of imaging 3D microvasculature. OMAG-based optical lymphangiography has been developed for 3D visualization of lymphatic vessels without the need for exogenous contrast agents. In this study, we utilize the optical lymphangiography to investigate dynamic changes in lymphatic response within skin tissue to depilation-induced inflammation by using mouse ear as a simple tissue model.
Materials and Methods
A spectral-domain optical coherence tomography (OCT) system is used in this study to acquire volumetric images of mouse ear. The system operates under the ultrahigh-sensitive OMAG scanning protocol with 5 repetitions for each B frame. An improved adaptive-threshold-based method is proposed to segment lymphatic vessels from OCT microstructure images. Depilation is achieved by placing hair removal lotion on mouse ear pinna for 5 minutes. 3 acquisitions are made before depilation, 3-minute and 30-minute post-depilation, respectively.
Results
Right after the application of depilation lotion on the skin, we observe that the blind-ended sacs of initial lymphatics are mainly visible in a specific area of the normal tissue. At 5 minutes, more collecting lymphatic vessels start to form, evidenced by their valve structure that only exists in collecting lymphatic vessels. The lymphangiogenesis is almost completed within 8 minutes in the inflammatory tissue.
Conclusions
Our experimental results demonstrate that the OMAG-based optical lymphangiography has great potential to improve the understanding of lymphatic system in response to various physiological conditions, thus would benefit the development of effective therapeutics.
Keywords: optical coherence tomography, optical microangiography, optical lymphangiography, depilation, lymphatic vasculature
Introduction
The lymphatic vasculature is a vital part of the circulatory system, responsible for absorbing intestinal lipid, collecting waste fluid from tissues, and delivering leukocytes and antigen-presenting cells to activate immune defense. It consists of a hierarchal network of initial and collecting lymphatic vessels, present in most organs in mammals. Malfunction in lymphatic system results in lymphedema formation and local immune-compromises. The lymphatic vascular network is also involved in metastasis of tumor cells, which is a leading cause of mortality in cancer patients.[1,2]
Visualization of the lymphatic vasculature is clinically important in the assessment of many pathologic conditions and diseases, providing useful information to guide the diagnosis and treatment accordingly. However, lymphatic vessels are generally difficult to visualize as they contain mainly clear lymph fluid that is optically transparent. It is difficult to locate and cannulate the lymphatic vessels with angiographic techniques. Conventional lymphography and lymphangiography require exogenous contrast agents injected into tissue space, which are subsequently absorbed by lymphatic vessels.[3] These techniques can visualize only peripheral lymphatic vessels draining the site of the injection.[4,5] Lymphoscintigraphy is more commonly used in the clinic, which utilizes radioactive tracers such as 99m-technetium (99m-Tc) injected in the tissue.[6-8] The tracer drained through the lymphatic system can be imaged with a scintillation camera that integrates the signal over time to produce a 2D image of the lymphatic network.[9,10] However, its poor spatial resolution does not allow clear identification of lymphatic vessels. Magnetic resonance lymphography (MRL) relies on variations in T1 or T2 relaxation times when protons are in different tissue environments and provides 30-100 times greater resolution than lymphoscintigraphy.[11] Notwithstanding, the resolution is still not sufficient enough to resolve lymphatic capillaries.[12] Some other imaging modalities, e.g., positron emission tomography (PET),[13,14] ultrasound imaging,[15,16] photoacoustic imaging,[17] and near-infrared fluorescence imaging,[18-20] have also been applied to image the lymphatic vasculature, but they all have a major drawback in that they are invasive in nature due to the need for exogenous contrast agents. The trauma caused by the injection of contrast agents can quickly alter lymphatic physiology near the injection area, which complicates the data interpretation.[4] Moreover, the potential chemical or radiation toxicity is also a concern. Therefore, noninvasive imaging techniques are required from the clinical point of view. Optical coherence tomography (OCT) is an emerging imaging technology that uses the intrinsic light scattering signal for image contrast.[21,22] As a variation of OCT, optical frequency domain imaging (OFDI) has recently been proposed for noninvasive label-free imaging of lymphatic vasculature based on the fact that the light scattering signal from lymph fluid is negligible compared to the signal originated from surrounding tissue.[23] Our previous works that used optical microangiography (OMAG), another extension of OCT technology,[24,25] have demonstrated promising capability of in vivo 3D imaging of the lymphatic valve structure as well as the lymphatic vessels down to capillary level.[26,27]
Mouse is widely used as a model organism owing to its high similarity to human in anatomy, physiology, and genetics.[28] In order to do surgery and imaging in mice, removal of the hair from the regions of interest is generally required.[29,30] Among the hair removal techniques, depilatory cream is most commonly employed for its ease of use. With calcium thioglycolate or potassium thioglycolate as active ingredients, depilatory cream can break down the disulfide bonds in keratin and weaken the hair so that the hair can be easily scraped off from hair follicle. Commercial depilatory creams, such as Nair, Veet, etc., have proven effective, atraumatic, and non-toxic, and are widely used for laboratory mouse models.[31] However, it should be noted that, due to the exposure (especially due to any possibly excessive exposure) to the chemical agent in the depilatory cream, the tissue can immediately respond with immune defense against the chemical irritation and initiate the lymphangiogenesis. This can influence the results of some lymphatics-related studies, such as wound healing, which has not been evaluated yet. Here we report an application of the use of OMAG-based optical lymphangiography to investigate dynamic lymphatic response to depilation-induced inflammation in a mouse ear.
Materials and methods
Experimental setup
The OMAG imaging system is schematically shown in Fig. 1. The light source was a SuperK Versa Supercontinuum Source (Koheras A/S, Denmark) pumped by an Nd:YAG laser, providing an output spectrum from 460 to 2400 nm and a maximum output power of 1.5 W. The output light from the SC source was passed through an optical filter that was specifically designed to filter and reshape the incoming spectrum into Gaussian shape with a center wavelength of 820 nm and a bandwidth of 120 nm, leading to an axial resolution of 3 μm for the imaging system. The filtered light was then coupled into a fiber-based spectral domain OCT. The optical power illuminated on the sample was measured at ∼3 mW. The lights reflected from the reference mirror and backscattered from the sample were combined and formed spectral interferograms that were subsequently received by a home-built high-speed spectrometer. The spectrometer consisted of a collimating lens, a volume transmission grating, and a complementary metal-oxide semiconductor (CMOS) line-scan camera (4096 pixels, Basler SPL 4096-140 km, Germany) that gives a maximum line-scan rate of 70 kHz. At this imaging rate, the sensitivity of the system was measured at ∼90 dB around the zero delay line and fell off to 70 dB at ±3 mm position. A 10× objective lens with an effective focal length of 18 mm was used as the scan lens that delivered light onto the sample with a lateral resolution of 9 μm. Simultaneous 3D imaging of blood and lymphatic vessels was accomplished by applying the OMAG scanning protocol in the imaging system.
Figure 1.

Schematic of OMAG imaging system.
OMAG scanning protocol
The ultra-high sensitive OMAG scanning protocol proposed in Ref. [32] was applied to acquire the OCT raw data. Briefly, in the fast scan (x) direction, 400 A-lines were captured to compose one B-scan cross sectional image. By setting a 4.5 μm spatial interval between every two A-lines, each B-scan frame covered a range of 1.8 mm in the X-direction. In the y-scanning direction, 2000 B-frames were captured (5 frames were acquired at each position, giving 400 total positions) to cover a range of 1.8 mm. With a 70 kHz A-line rate the frame rate of the system was 250 frames per second. The system required 8 seconds to finish one 3D acquisition, which is short enough to minimize motion artifacts for in vivo imaging in the study.
By post-processing the 3D raw data with the OMAG algorithm, we obtained the images of the microstructure and the blood vasculature simultaneously. Each cross-sectional microstructure image was produced by averaging five B-frames captured at the same cross section location. The averaging strategy can significantly reduce random noise and smooth the microstructure images. Subsequently, the lymphangiograms were extracted from the microstructure images.
Optical lymphangiography
Several automatic segmentation algorithms have been developed for extracting lymphatic vessels from OCT microstructure images.[26,27,33] In principle, they are designed to identify the lymphatic vessels based on the fact that the lymph fluid is optically transparent, thus giving optical signals near system noise floor. In this study, we utilized an improved segmentation approach based on adaptive threshold method proposed in Ref. [26]. In Ref. [26], the adaptive threshold segmentation algorithm does not take two factors into account that can influence the segmentation accuracy: 1) the shadow cast by blood vessels and 2) the relative weak signal intensity in deep tissue due to the light attenuation along depth. To mitigate these issues, we pre-processed the microstructure images to remove the vessel-induced shadow and enhance the contrast by utilizing a method proposed by Girard et al.[34] This method introduces an attenuation term, which is proportional to local reflectivity in the tissue, in the governing OCT equations. It mathematically describes the progressive attenuation caused by local scattering due to tissue inhomogeneity and degradation, which can be compensated by calculating the attenuation coefficients. Furthermore, in Girard approach, the image contrast can be enhanced by pixel intensity exponentiation. After that, an adaptive threshold was calculated by the intensity of the pixels within a local window around a target pixel to perform binarization operation. The window size was designed to be adjustable according to local lymphatic vessel size. If the intensity of a target pixel was lower than the adaptive threshold, it was judged to belong to lymphatic vessel and assigned a value of 1; otherwise it was assigned a 0. Such segmentation on cross-sectional microstructure images was performed frame by frame for whole 3D datasets. As a result, a 3D data volume representing lymphatic vessels were finally obtained.
Figure 2 shows an example for how the lymphatic vessels were segmented from a cross-sectional microstructure image of the mouse ear. Figure 2(a) is the original microstructure image. It can be clearly seen that many stripe-like shadows exist in the tissue area and appear as dark intensity signals. They may produce false positive segmentations and thus result in a noisy lymphangiogram if the lymphatic segmentation algorithm is directly applied to the original microstructure image. Figure 2(b) is a contrast-enhanced image that was preprocessed to compensate the light attenuation in tissue and remove the shadows below blood vessels. By binarizing and segmenting it with an adaptive threshold, a clear cross-sectional image of lymphatic vessels, Fig. 2(c), was obtained. As the improved algorithm can effectively eliminate false judgment resulted from dark shadows and attenuated intensity, we were able to achieve reliable segmentation for lymphatic vessels.
Figure 2.

(a) Cross-sectional OCT microstructure image of the mouse ear, (b) contrast-enhanced image based on (a), (c) lymphatic vessels segmented from (b).
Experimental procedure
All experimental animal procedures were carried out in conformity with the guidelines of the National Institute of Health for care and handling of laboratory animals. The laboratory animal protocol used in this study was approved by the University of Washington Institutional Animal Care and Use Committee (UW-IACUC). The mouse type chosen for this study was SKH-1 hairless mouse (23 to 25 g, Charles River, Hollister, CA), because this mouse strain has scarce hairs, enabling us to take an acquisition before depilation as the control. The experimental procedure was as follow: the mouse was anesthetized with isoflurane (0.2 L/min oxygen and 0.8 L/min air) by a face mask. The mouse pinna was immobilized on a precision stereotaxic stage to minimize its movement due to its breathing and heartbeat. The body temperature was maintained between 36.7 to 37.1 °C monitored by a rectal thermal probe. The first acquisition was taken prior to the depilation. After that, an even thin layer of the Nair hair removal lotion was placed onto the mouse ear surface. The lotion was left on for 5 minutes and removed by wiping the area with a water-moistened gauze pad. When the skin surface was cleaned and dried out, the second acquisition was performed to record the immediate lymphatic response at 3-minutes post-depilation. The third acquisition was made at 30-minutes post-depilation to follow up the changes in lymphatic vasculature. The experiment was terminated at the time point of 30-minutes post-depilation due to the limitation of the current laboratory animal protocol, and the mouse was euthanatized subsequently.
Results
Figure 3 shows the blood vessel angiograms and lymphangiograms of the mouse pinna before and after the depilation, which were acquired with the OMAG system at three time points. Both the blood and lymphatic vessels were obtained through maximum projection from the en face views of the 3D data volumes. The t axis drawn above the images indicates the time lapse direction. The two images in the first column are the blood vessel angiogram (top) and the lymphangiogram (bottom), respectively, captured before the depilation (baselines). Thereafter, a 5-minute depilation process was performed on the mouse ear. The second and the third columns reveal the imaging results at 3-minutes and 30-minutes post-depilation, respectively. For all the six images, the relative depth information is encoded with different colors. A deeper color represents a more superficial depth in each 3D volume. From the lymphangiograms, we can clearly see the changes in lymphatic vasculature upon the depilation. In the baseline lymphangiogram, the lymphatic vasculature mostly appears as separated dots, which are blind-ended sacs of the initial lymphatics (lymphatic capillaries) that absorb fluid and proteins leaked from blood vessels.[35,36] The lumen of the lymphatic capillary is not visible because it consists of only a single layer of epitheliums, and in normal tissues, the lumen is often collapsed. The thickness of the lumen (50-100 nanometers)[37] is far beyond the resolution of the imaging system. At 3-minutes post-depilation, new collecting lymphatic vessels were formed to create a vascular network. In contrast to initial lymphatics, collecting lymphatic vessels have one more layer of overlying smooth muscle cells and exhibit intraluminal valves. They can actively transport lymph to central lymphatic-venous junctions through the coordinated contraction of the valves, making the lymph flows unidirectional.[38] It should be noted that the new-formed collecting lymphatic vessels were not derived from simple connection and enlargement of pre-existing lymphatics. Apparently, the new and pre-existing vessels are not matched in locations. The collecting lymphatic vessels were generated through the lymphangiogenesis in coordination with complex cellular events, including proliferation, sprouting, migration and tube formation.[36] At 30-minute post-depilation, the lymphatic vasculature was further developed. Some of the separated vessels were connected and some were enlarged, while overall the lymphatic network looked similar to the previous one. It demonstrated that the lymphangiogenesis, initiated by the depilation-induced inflammation, was almost completed within the first 8 minutes (5-minutes depilation + 3-minutes post-depilation).
Figure 3.

Imaging results of simultaneous optical microangiography and lymphangiography in the mouse ear before and after 5-minute depilation. Images in the first row are en face maximum projection view of the 3D angiograms; images in the bottom row are en face maximum projection view of the 3D lymphangiograms. The depth information is encoded with colors. The t axis indicates the time points of the acquisitions. The field of view of each image is 1.8 × 1.8 mm2.
From the three blood vessel angiograms, we observed reduction in blood vessels after the depilation. However, it may not be true in this case. Because the depilation led to edema in the mouse ear, more and more interstitial fluid was accumulated in the tissue, and the tissue thickness changed significantly. Therefore, the blood vessels located in deeper tissues were weakened or disappeared in the angiograms due to low OCT signal.
We have also evaluated the changes in tissue thickness through measurements on cross-sectional microstructure images, as shown in Fig. 4. Here we define the tissue thickness as the distance between the epidermis layer and the articular cartilage. The measurements of thickness were made on 6 cross-sections at 6 separated locations (18 cross-sectional images in total for the 3 time points). Figs. 4(a)-(c), as an example, are cross-sectional images at one of the 6 measured locations at the three time points. The measurement results were statistically summarized with a column chart (Fig. 4(d)). From the baseline image, the tissue thickness was measured to be 164 ± 23.3 μm, while it was increased to 311 ± 29.5 μm at 3-minutes post-depilation and 344 ± 36.0 μm at 30-minutes post-depilation (all the numbers are mean values). Resulted from the depilation-induced edema, the tissue thickness was doubled. Consequently, more attenuation was introduced to OMAG signals from blood vessels in deep tissue after the depilation. In addition, irritation in skin caused by the chemical agents in the hair removal lotion can change tissue property and refractive index. The increased refractive index within tissue region between the epidermis layer and the sebaceous glands resulted in higher reflection and thus statistical noise in this area. This can be explained by the increased background noise in the 2 blood vessel angiograms, 3-min and 30-min post-depilation, in Fig. 3. The background noise in these 2 images appears as deep red color, meaning that it was originated from the relatively top layers of the tissue. This is probably another main reason why fewer blood vessels were visible after the depilation.
Figure 4.

Cross-sectional microstructure images of the same location at different time points: (a) Baseline, (b) 3-minute post-depilation, (c) 30-minute post-depilation, (d) measured tissue thickness at the three time points, error bars indicate the standard deviation from 6 measurements. E: epidermis, D: dermis, A: articular cartilage, red arrows point to lymphatic vessels.
To quantitatively analyze the lymphatic response to the depilation, we evaluated the lymphangiograms in terms of fractal dimension (FD) and lymphatic vessel area density (VAD) over given areas. An FD is a value that indicates how an image fills space as one zooms into smaller scale, and thus it can be employed to describe the vessel tortuosity.[39] VAD is defined as the area of the lymphatic vessels in the projection view image divided by the full area of the image.[27] We utilized the method described by Reif et al. [40] to calculate the FDs and VADs for the lymphangiograms obtained at the three imaging time points. Each lymphangiogram was divided into four equal sub-images from the four corners and performed quantification with each sub-image. The calculation results are statistically shown in Fig. 5. The results confirm the trend of the lymphangiogenesis upon the depilation that the lymphatic vessels were significantly increased in terms of density at 3-minute post-depilation and progressively enlarged in diameter thereafter.
Figure 5.
Mean and standard deviation of fractal dimension and vessel area density for the lymphangiograms obtained at the three imaging time points. Values for each time point were calculated with four sub-images that were equally divided from the four corners.
Discussion
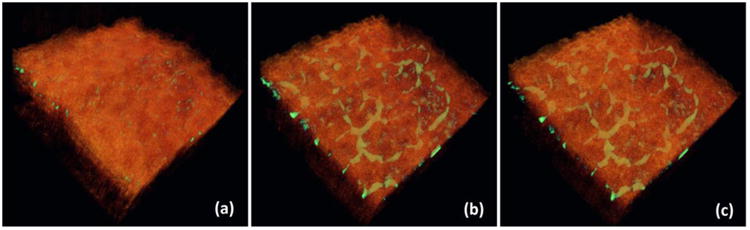
One advantage of using the OCT/OMAG modality to image the lymphatic vasculature is that it can co-register the lymphangiogram with the corresponding microstructure image in a single 3D volume with depth-resolved capability. This is important because it can provide valuable information to correlate the lymphangiogenesis or lymphatic remodeling with the surrounding tissue bed. In Fig. 6, we merged the 3D lymphangiograms and the 3D microstructure of the tissues to better appreciate their positional relations. The lymphatic vessels are in green color while the tissues are in orange. Since the OCT/OMAG technique is a depth-resolved imaging tool, it is readily feasible to visualize any structure of interest at any cross section from any orientation.
Figure 6.

Co-registration of the 3D lymphangiograms and the 3D microstructure images of the three time points: (a) Baseline, (b) 3-minutes post-depilation, and (c) 30-minutes post-depilation.
Although the OMAG-based optical lymphangiography offers depth-resolved noninvasive 3D imaging of lymphatic vessels, some drawbacks may limit its potential applications. For instance, both the penetration depth and the depth of focus are limited, compared to conventional in vivo lymphangiography. The current OMAG imaging system utilizes a high NA (10×) objective lens on the sample arm so that the depth of focus is only a few hundreds microns in the tissue. A potential solution is to use dynamic focusing technique by moving the sample in vertical direction and taking several acquisitions at different depths. Moreover, the typical penetration depth of spectral domain OCT imaging system is several millimeters (specifically, 1 mm for the OMAG imaging system used in this study), which is shallower than that of most conventional lymphatic imaging techniques. It is ideal for a mouse ear model because the thickness of the mouse ear is less than 1 mm, but it is in sufficient for imaging lymphatic vessels in human skins, especially collecting lymphatics as well as afferent and efferent lymphatic vessels in deep skins. Alternatively, longer wavelength light source or swept-source OCT imaging modality can be employed to enhance the penetration depth with lower lateral resolution as the trade-off. A commercial swept-source OCT system can achieve an imaging depth range over 10 mm (practically, >2 mm in tissue), while it is still not comparable to clinically utilized lymphatic imaging approaches, such as Lymphoscintigraphy (>10 cm imaging depth).
It should be noted that the OMAG-based optical lymphangiography is not sensitive to lymphangiogenic growth factors. It is not able to distinguish new lymphatic vessels caused by lymphangiogenesis and lymphatic remodeling. A lymphatic vessel can be detected by OMAG-based lymphangiography only if the vessel tube has been completely formed and perfused with lymph fluid, because the imaging principle is based on the fact that the lymph fluid is optically transparent and appears as dark signal in the OCT microstructure image. The detected lymphatic vessel might be resulted from either dilation of a pre-existing lymphatic capillary, which was collapsed and therefore not visible previously, or complex cellular activities involved in lymphangiogenesis. Validation usually requires further studies using other imaging technologies.
Conclusions
In conclusion, we have applied the OMAG-based optical lymphangiography to monitor the lymphatic response to the depilation-induced inflammation. OMAG allowed for the noninvasive visualization and quantification of lymphatic vasculature changes over time. There were mostly initial lymphatics detected in the normal mouse ear, while new collecting lymphatic vessels were formed rapidly after the depilation. Our experimental results demonstrated the optical lymphangiography could be a practical tool for tracking the lymphatic system in vivo, providing novel insight for clinic and diagnostic purposes. However, more comprehensive understanding, in both morphology and physiology, of the lymphangiogenesis stimulated by the depilation requires further research efforts, which is beyond the scope of this study.
Acknowledgments
This work was supported in part by research grants from the National Institutes of Health (RO1EB009682 and RO1HL093140). The funders had no role in study design, data collection and analysis, decision to publish, or preparation of the manuscript.
References
- 1.Alitalo K, Tammela T, Petrova TV. Lymphangiogenesis in development and human disease. Nature. 2005;438(7070):946–953. doi: 10.1038/nature04480. [DOI] [PubMed] [Google Scholar]
- 2.Oliver G. Lymphatic vasculature development. Nat Rev Immunol. 2004;4(1):35–45. doi: 10.1038/nri1258. [DOI] [PubMed] [Google Scholar]
- 3.Kinmonth JB. Lymphangiography in man; a method of outlining lymphatic trunks at operation. Clin Sci (Lond) 1952;11(1):13–20. [PubMed] [Google Scholar]
- 4.Munn LL, Padera TP. Imaging the lymphatic system. Microvasc Res. 2014;96:55–63. doi: 10.1016/j.mvr.2014.06.006. [DOI] [PMC free article] [PubMed] [Google Scholar]
- 5.Clement O, Luciani A. Imaging the lymphatic system: possibilities and clinical applications. Eur Radiol. 2004;14(8):1498–1507. doi: 10.1007/s00330-004-2265-9. [DOI] [PubMed] [Google Scholar]
- 6.Weissleder R, Thrall JH. The lymphatic system: diagnostic imaging studies. Radiology. 1989;172(2):315–317. doi: 10.1148/radiology.172.2.2748809. [DOI] [PubMed] [Google Scholar]
- 7.Mihara M, Hara H, Narushima M, Mitsui K, Murai N, Koshima I. Low-invasive lymphatic surgery and lymphatic imaging for completely healed intractable pudendal lymphorrhea after gynecologic cancer treatment. J Minim Invasive Gynecol. 2012;19(5):658–662. doi: 10.1016/j.jmig.2012.04.005. [DOI] [PubMed] [Google Scholar]
- 8.Sevick-Muraca EM, Kwon S, Rasmussen JC. Emerging lymphatic imaging technologies for mouse and man. J Clin Invest. 2014;124(3):905–914. doi: 10.1172/JCI71612. [DOI] [PMC free article] [PubMed] [Google Scholar]
- 9.Shih WJ, Sloan DA, Hackett MT, Ryo UY, Weizbinski B, Coupal JJ, Magoun S. Lymphoscintigraphy of melanoma: lymphatic channel activity guides localization of sentinel lymph nodes, and gamma camera imaging/counting confirms presence of radiotracer in excised nodes. Ann Nucl Med. 2001;15(1):1–11. doi: 10.1007/BF03012124. [DOI] [PubMed] [Google Scholar]
- 10.Kim SH, Shim J, Kim CK, Machac J, Krynyckyi BR. Reverse echelon node and a lymphatic ectasia in the same patient during breast lymphoscintigraphy: the importance of injection and imaging technique. Br J Radiol. 2004;77(924):1053–1056. doi: 10.1259/bjr/65044256. [DOI] [PubMed] [Google Scholar]
- 11.Harisinghani MG, Saksena M, Ross RW, Tabatabaei S, Dahl D, McDougal S, Weissleder R. A pilot study of lymphotrophic nanoparticle-enhanced magnetic resonance imaging technique in early stage testicular cancer: a new method for noninvasive lymph node evaluation. Urology. 2005;66(5):1066–1071. doi: 10.1016/j.urology.2005.05.049. [DOI] [PubMed] [Google Scholar]
- 12.Choi HJ, Roh JW, Seo SS, Lee S, Kim JY, Kim SK, Kang KW, Lee JS, Jeong JY, Park SY. Comparison of the accuracy of magnetic resonance imaging and positron emission tomography/computed tomography in the presurgical detection of lymph node metastases in patients with uterine cervical carcinoma: a prospective study. Cancer. 2006;106(4):914–922. doi: 10.1002/cncr.21641. [DOI] [PubMed] [Google Scholar]
- 13.Birim O, Kappetein AP, Stijnen T, Bogers AJ. Meta-analysis of positron emission tomographic and computed tomographic imaging in detecting mediastinal lymph node metastases in nonsmall cell lung cancer. Ann Thorac Surg. 2005;79(1):375–382. doi: 10.1016/j.athoracsur.2004.06.041. [DOI] [PubMed] [Google Scholar]
- 14.Takenaka T, Yano T, Morodomi Y, Ito K, Miura N, Kawano D, Shoji F, Baba S, Abe K, Honda H, Maehara Y. Prediction of true-negative lymph node metastasis in clinical IA non-small cell lung cancer by measuring standardized uptake values on positron emission tomography. Surg Today. 2012;42(10):934–939. doi: 10.1007/s00595-012-0277-7. [DOI] [PubMed] [Google Scholar]
- 15.Abe H, Schacht D, Kulkarni K, Shimauchi A, Yamaguchi K, Sennett CA, Jiang Y. Accuracy of axillary lymph node staging in breast cancer patients: an observer-performance study comparison of MRI and ultrasound. Acad Radiol. 2013;20(11):1399–1404. doi: 10.1016/j.acra.2013.08.003. [DOI] [PubMed] [Google Scholar]
- 16.Yasufuku K, Nakajima T, Motoori K, Sekine Y, Shibuya K, Hiroshima K, Fujisawa T. Comparison of endobronchial ultrasound, positron emission tomography, and CT for lymph node staging of lung cancer. Chest. 2006;130(3):710–718. doi: 10.1378/chest.130.3.710. [DOI] [PubMed] [Google Scholar]
- 17.Kim C, Song KH, Gao F, Wang LV. Sentinel lymph nodes and lymphatic vessels: noninvasive dual-modality in vivo mapping by using indocyanine green in rats--volumetric spectroscopic photoacoustic imaging and planar fluorescence imaging. Radiology. 2010;255(2):442–450. doi: 10.1148/radiol.10090281. [DOI] [PMC free article] [PubMed] [Google Scholar]
- 18.Sharma R, Wendt JA, Rasmussen JC, Adams KE, Marshall MV, Sevick-Muraca EM. New horizons for imaging lymphatic function. Ann N Y Acad Sci. 2008;1131:13–36. doi: 10.1196/annals.1413.002. [DOI] [PMC free article] [PubMed] [Google Scholar]
- 19.Rasmussen JC, Tan IC, Marshall MV, Fife CE, Sevick-Muraca EM. Lymphatic imaging in humans with near-infrared fluorescence. Curr Opin Biotechnol. 2009;20(1):74–82. doi: 10.1016/j.copbio.2009.01.009. [DOI] [PMC free article] [PubMed] [Google Scholar]
- 20.Zhang J, Zhou SK, Xiang X, Bautista ML, Niccum BA, Dickinson GS, Tan IC, Chan W, Sevick-Muraca EM, Rasmussen JC. Automated analysis of investigational near-infrared fluorescence lymphatic imaging in humans. Biomed Opt Express. 2012;3(7):1713–1723. doi: 10.1364/BOE.3.001713. [DOI] [PMC free article] [PubMed] [Google Scholar]
- 21.Tomlins PH, Wang RK. Theory, developments and applications of optical coherence tomography. J Phys D Appl Phys. 2005;38(15):2519–2535. [Google Scholar]
- 22.Huang D, Swanson EA, Lin CP, Schuman JS, Stinson WG, Chang W, Hee MR, Flotte T, Gregory K, Puliafito CA, et al. Optical coherence tomography. Science. 1991;254(5035):1178–1181. doi: 10.1126/science.1957169. [DOI] [PMC free article] [PubMed] [Google Scholar]
- 23.Vakoc BJ, Lanning RM, Tyrrell JA, Padera TP, Bartlett LA, Stylianopoulos T, Munn LL, Tearney GJ, Fukumura D, Jain RK, Bouma BE. Three-dimensional microscopy of the tumor microenvironment in vivo using optical frequency domain imaging. Nat Med. 2009;15(10):1219–1223. doi: 10.1038/nm.1971. [DOI] [PMC free article] [PubMed] [Google Scholar]
- 24.An L, Qin J, Wang RK. Ultrahigh sensitive optical microangiography for in vivo imaging of microcirculations within human skin tissue beds. Opt Express. 2010;18(8):8220–8228. doi: 10.1364/OE.18.008220. [DOI] [PMC free article] [PubMed] [Google Scholar]
- 25.Wang RK, An L, Francis P, Wilson DJ. Depth-resolved imaging of capillary networks in retina and choroid using ultrahigh sensitive optical microangiography. Opt Lett. 2010;35(9):1467–1469. doi: 10.1364/OL.35.001467. [DOI] [PMC free article] [PubMed] [Google Scholar]
- 26.Zhi Z, Jung Y, Wang RK. Label-free 3D imaging of microstructure, blood, and lymphatic vessels within tissue beds in vivo. Opt Lett. 2012;37(5):812–814. doi: 10.1364/OL.37.000812. [DOI] [PMC free article] [PubMed] [Google Scholar]
- 27.Yousefi S, Qin J, Zhi Z, Wang RK. Label-free optical lymphangiography: development of an automatic segmentation method applied to optical coherence tomography to visualize lymphatic vessels using Hessian filters. J Biomed Opt. 2013;18(8):86004. doi: 10.1117/1.JBO.18.8.086004. [DOI] [PMC free article] [PubMed] [Google Scholar]
- 28.Frese KK, Tuveson DA. Maximizing mouse cancer models. Nat Rev Cancer. 2007;7(9):645–658. doi: 10.1038/nrc2192. [DOI] [PubMed] [Google Scholar]
- 29.Hoffman RM. The new cell biology: in vivo imaging with fluorescent proteins. Mol Biol Cell. 2004;15:101a–101a. [Google Scholar]
- 30.National Research Council (U.S.). Committee for the Update of the Guide for the Care and Use of Laboratory Animals., Institute for Laboratory Animal Research (U.S.), National Academies Press (U.S.) Guide for the care and use of laboratory animals. xxv. Washington, D.C.: National Academies Press; 2011. p. 220. [Google Scholar]
- 31.Vestal PW. Preoperative preparation of the skin with a depilatory cream and a detergent. Am J Surg. 1952;83(3):398–402. doi: 10.1016/0002-9610(52)90277-8. [DOI] [PubMed] [Google Scholar]
- 32.Zhi ZW, Cepurna W, Johnson E, Shen T, Morrison J, Wang RKK. Volumetric and quantitative imaging of retinal blood flow in rats with optical microangiography. Biomed Opt Express. 2011;2(3):579–591. doi: 10.1364/BOE.2.000579. [DOI] [PMC free article] [PubMed] [Google Scholar]
- 33.Kalchenko V, Kuznetsov Y, Meglinski I, Harmelin A. Label free in vivo laser speckle imaging of blood and lymph vessels. J Biomed Opt. 2012;17(5):050502. doi: 10.1117/1.JBO.17.5.050502. [DOI] [PubMed] [Google Scholar]
- 34.Girard MJA, Strouthidis NG, Ethier CR, Mari JM. Shadow Removal and Contrast Enhancement in Optical Coherence Tomography Images of the Human Optic Nerve Head. Invest Ophth Vis Sci. 2011;52(10):7738–7748. doi: 10.1167/iovs.10-6925. [DOI] [PubMed] [Google Scholar]
- 35.Schulte-Merker S, Sabine A, Petrova TV. Lymphatic vascular morphogenesis in development, physiology, and disease. J Cell Biol. 2011;193(4):607–618. doi: 10.1083/jcb.201012094. [DOI] [PMC free article] [PubMed] [Google Scholar]
- 36.Stacker SA, Williams SP, Karnezis T, Shayan R, Fox SB, Achen MG. Lymphangiogenesis and lymphatic vessel remodelling in cancer. Nat Rev Cancer. 2014;14(3):159–172. doi: 10.1038/nrc3677. [DOI] [PubMed] [Google Scholar]
- 37.Margaris KN, Black RA. Modelling the lymphatic system: challenges and opportunities. J R Soc Interface. 2012;9(69):601–612. doi: 10.1098/rsif.2011.0751. [DOI] [PMC free article] [PubMed] [Google Scholar]
- 38.Dellinger M, Hunter R, Bernas M, Gale N, Yancopoulos G, Erickson R, Witte M. Defective remodeling and maturation of the lymphatic vasculature in Angiopoietin-2 deficient mice. Dev Biol. 2008;319(2):309–320. doi: 10.1016/j.ydbio.2008.04.024. [DOI] [PMC free article] [PubMed] [Google Scholar]
- 39.Huang PW, Lee CH. Automatic classification for pathological prostate images based on fractal analysis. IEEE Trans Med Imaging. 2009;28(7):1037–1050. doi: 10.1109/TMI.2009.2012704. [DOI] [PubMed] [Google Scholar]
- 40.Reif R, Qin J, An L, Zhi Z, Dziennis S, Wang R. Quantifying optical microangiography images obtained from a spectral domain optical coherence tomography system. Int J Biomed Imaging. 2012;2012:509783. doi: 10.1155/2012/509783. [DOI] [PMC free article] [PubMed] [Google Scholar]